When used together, Spectator (or Servo) and Atlas provide a near real-time operational insight platform. Spectator and Servo are Netflix’s metrics collection libraries. Atlas is a Netflix metrics backend that manages dimensional time-series data.
Servo served Netflix for several years and is still usable but is gradually being phased out in favor of Spectator, which is designed to work only with Java 8. Spring Cloud Netflix provides support for both, but Java 8-based applications are encouraged to use Spectator.
Spring Boot Actuator metrics are hierarchical, and the metrics are separated only by name.
These names often follow a naming convention that embeds key/value attribute pairs (dimensions) into the name (separated by periods).
Consider the following metrics for two endpoints, root and star-star:
{
    "counter.status.200.root": 20,
    "counter.status.400.root": 3,
    "counter.status.200.star-star": 5,
}
The first metric gives us a normalized count of successful requests against the root endpoint per unit of time.
But what if the system has 20 endpoints and you want to get a count of successful requests against all the endpoints?
Some hierarchical metrics backends would let you specify a wildcard, such as counter.status.200.*, that would read all 20 metrics and aggregate the results.
Alternatively, you could provide a HandlerInterceptorAdapter that intercepts and records a metric such as counter.status.200.all for all successful requests irrespective of the endpoint, but now you must write 20+1 different metrics.
Similarly, if you want to know the total number of successful requests for all endpoints in the service, you could specify a wildcard such as counter.status.2*.*.
Even in the presence of wildcarding support on a hierarchical metrics backend, naming consistency can be difficult.
Specifically, the position of these tags in the name string can slip with time, breaking queries.
For example, suppose we add an additional dimension to the earlier hierarchical metrics for an HTTP method.
Then counter.status.200.root becomes counter.status.200.method.get.root (or post and so on).
Suddenly, Our counter.status.200.* no longer has the same semantic meaning.
Furthermore, if the new dimension is not applied uniformly across the codebase, certain queries may become impossible.
This can quickly get out of hand.
Netflix metrics are tagged (in other words, they are dimensional). Each metric has a name, but this single named metric can contain multiple statistics and 'tag' key/value pairs, which allows more querying flexibility. In fact, the statistics themselves are recorded in a special tag.
When recorded with Netflix Servo or Spectator, a timer for the root endpoint described earlier contains four statistics for each status code, where the count statistic is identical to Spring Boot Actuator’s counter. When we have encountered an HTTP 200 and 400 with the preceding examples, there are eight available data points, as shown in the following example:
{
    "root(status=200,stastic=count)": 20,
    "root(status=200,stastic=max)": 0.7265630630000001,
    "root(status=200,stastic=totalOfSquares)": 0.04759702862580789,
    "root(status=200,stastic=totalTime)": 0.2093076914666667,
    "root(status=400,stastic=count)": 1,
    "root(status=400,stastic=max)": 0,
    "root(status=400,stastic=totalOfSquares)": 0,
    "root(status=400,stastic=totalTime)": 0,
}
Without any additional dependencies or configuration, a Spring Cloud based service autoconfigures a Servo MonitorRegistry and begins collecting metrics on every Spring MVC request.
By default, a Servo timer with a name of rest is recorded for each MVC request, which is tagged with the following information:
- HTTP method (
GET,POST, and so on). - HTTP status (
200,400,500, and so on). - URI (or
rootif the URI is empty), sanitized for Atlas. - The exception class name, if the request handler threw an exception.
- The caller, if a request header with a key matching
netflix.metrics.rest.callerHeaderis set on the request. There is no default key fornetflix.metrics.rest.callerHeader. You must add it to your application properties if you wish to collect caller information.
Set the netflix.metrics.rest.metricName property to change the name of the metric from rest to the name you provide.
If Spring AOP is enabled and org.aspectj:aspectjweaver is present on your runtime classpath, Spring Cloud also collects metrics on every client call made with RestTemplate.
A Servo timer with a name of restclient is recorded for each MVC request, which is tagged with the following information:
- HTTP method ('GET', 'POST', and so on).
- HTTP status (
200,400,500, and so on) and possiblyCLIENT_ERRORif the response returned null orIO_ERRORif anIOExceptionoccurred during the execution of theRestTemplatemethod. - URI, sanitized for Atlas.
- Client name.
![[Warning]](images/warning.png) | Warning |
|---|---|
Avoid using hard-coded URL parameters within |
// recommended
String orderid = "1";
restTemplate.getForObject("http://testeurekabrixtonclient/orders/{orderid}", String.class, orderid)

// avoid
restTemplate.getForObject("http://testeurekabrixtonclient/orders/1", String.class)
To enable Spectator metrics, include a dependency on spring-boot-starter-spectator, as follows:
    <dependency>
        <groupId>org.springframework.cloud</groupId>
        <artifactId>spring-cloud-starter-netflix-spectator</artifactId>
    </dependency>
In Spectator parlance, a meter is a named, typed, and tagged configuration, while a metric represents the value of a given meter at a point in time. Spectator meters are created and controlled by a registry, which currently has several different implementations. Spectator provides four meter types: counter, timer, gauge, and distribution summary.
Spring Cloud Spectator integration configures an injectable com.netflix.spectator.api.Registry instance for you.
Specifically, it configures a ServoRegistry instance in order to unify the collection of REST metrics and the exporting of metrics to the Atlas backend under a single Servo API.
Practically, this means that your code may use a mixture of Servo monitors and Spectator meters.
Spring Boot scoops up both Actuator MetricReader instances and ships them to the Atlas backend.
A counter measures the rate at which some event is occurring, as shown in the following example:
// create a counter with a name and a set of tags
Counter counter = registry.counter("counterName", "tagKey1", "tagValue1", ...);
counter.increment(); // increment when an event occurs
counter.increment(10); // increment by a discrete amount
The counter records a single time-normalized statistic.
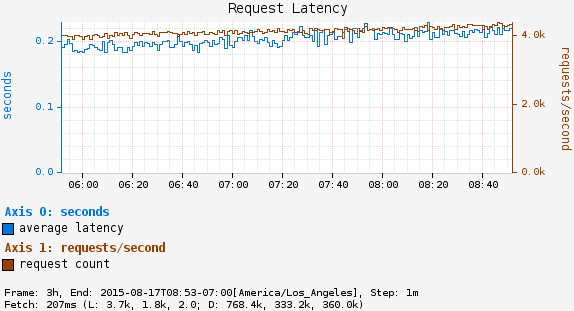
A timer measures how long some event takes.
Spring Cloud automatically records timers for Spring MVC requests and, conditionally, RestTemplate requests, which can later be used to create dashboards for request related metrics like latency, as shown in the following example:
// create a timer with a name and a set of tags
Timer timer = registry.timer("timerName", "tagKey1", "tagValue1", ...);

// execute an operation and time it at the same time
T result = timer.record(() -> fooReturnsT());

// alternatively, if you must manually record the time
Long start = System.nanoTime();
T result = fooReturnsT();
timer.record(System.nanoTime() - start, TimeUnit.NANOSECONDS);
The timer simultaneously records four statistics: count, max, totalOfSquares, and totalTime.
The count statistic always matches the single normalized value provided by a counter as though you had called increment() once on the counter for each time you recorded a timing, so it is rarely necessary to count and time separately for a single operation.
For long-running operations, Spectator provides a special LongTaskTimer.
Gauges show some current value, such as the size of a queue or number of threads in a running state. Since gauges are sampled, they provide no information about how these values fluctuate between samples.
The normal use of a gauge involves registering the gauge once on initialization with an ID, a reference to the object to be sampled, and a function to get or compute a numeric value based on the object. The reference to the object is passed in separately, and the Spectator registry keeps a weak reference to the object. If the object is garbage collected, Spectator automatically drops the registration. See the note in Spectator’s documentation about potential memory leaks if this API is misused. The following listing shows how to automatically and manually sample a gauge:
// the registry automatically samples this gauge periodically
registry.gauge("gaugeName", pool, Pool::numberOfRunningThreads);

// manually sample a value in code at periodic intervals -- last resort!
registry.gauge("gaugeName", Arrays.asList("tagKey1", "tagValue1", ...), 1000);
A distribution summary tracks the distribution of events. It is similar to a timer but more general in that the size does not have to be a period of time. For example, a distribution summary could be used to measure the payload sizes of requests hitting a server. The following example defines a distribution summary:
// the registry automatically samples this gauge periodically
DistributionSummary ds = registry.distributionSummary("dsName", "tagKey1", "tagValue1", ...);
ds.record(request.sizeInBytes());
![[Note]](images/note.png) | Note |
|---|---|
If your code is compiled on Java 8, use Spectator instead of Servo, as Spectator is destined to replace Servo entirely. |
In Servo parlance, a monitor is a named, typed, and tagged configuration, and a metric represents the value of a given monitor at a point in time.
Servo monitors are logically equivalent to Spectator meters.
Servo monitors are created and controlled by a MonitorRegistry.
While it is still available, Servo has a wider array of monitor options than Spectator has meters.
Spring Cloud integration configures an injectable com.netflix.servo.MonitorRegistry instance for you.
Once you have created the appropriate Monitor type in Servo, the process of recording data is similar to that of Spectator.
If you use the Servo MonitorRegistry instance provided by Spring Cloud (specifically, an instance of DefaultMonitorRegistry), Servo provides convenience classes for retrieving counters and timers.
These convenience classes ensure that only one Monitor is registered for each unique combination of name and tags.
To manually create a Monitor type in Servo, especially for the more exotic monitor types for which convenience methods are not provided, instantiate the appropriate type by providing a MonitorConfig instance, as shown in the following example:
MonitorConfig config = MonitorConfig.builder("timerName").withTag("tagKey1", "tagValue1").build();

// somewhere we should cache this Monitor by MonitorConfig
Timer timer = new BasicTimer(config);
monitorRegistry.register(timer);