3.0.0-SNAPSHOT
1. Overview
Spring Cloud Sleuth provides Spring Boot auto-configuration for distributed tracing. Underneath, Spring Cloud Sleuth is a layer over a Tracer library named Brave.
Sleuth configures everything you need to get started. This includes where trace data (spans) are reported to, how many traces to keep (sampling), if remote fields (baggage) are sent, and which libraries are traced.
We maintain an example app where two Spring Boot services collaborate on an HTTP request. Sleuth configures these apps, so that timing of these requests are recorded into Zipkin, a distributed tracing system. Tracing UIs visualize latency, such as time in one service vs waiting for other services.
Here’s an example of what it looks like:
The source repository of this example includes demonstrations of many things, including WebFlux and messaging. Most features require only a property or dependency change to work. These snippets showcase the value of Spring Cloud Sleuth: Through auto-configuration, Sleuth make getting started with distributed tracing easy!
To keep things simple, the same example is used throughout documentation using basic HTTP communication.
2. Features
Sleuth sets up instrumentation not only to track timing, but also to catch
errors so that they can be analyzed or correlated with logs. This works the
same way regardless of if the error came from a common instrumented library,
such as RestTemplate, or your own code annotated with @NewSpan or similar.
Below, we’ll use the word Zipkin to describe the tracing system, and include Zipkin screenshots. However, most services accepting Zipkin format have similar base features. Sleuth can also be configured to send data in other formats, something detailed later.
2.1. Contextualizing errors
Without distributed tracing, it can be difficult to understand the impact of a an exception. For example, it can be hard to know if a specific request caused the caller to fail or not.
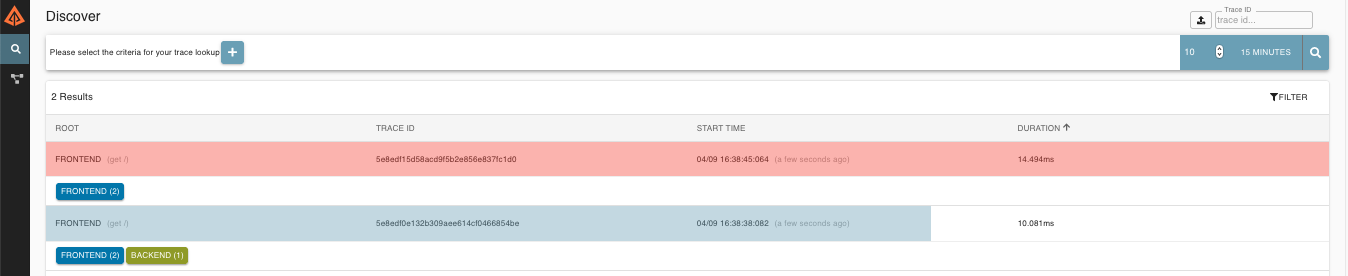
Zipkin reduces time in triage by contextualizing errors and delays.
Requests colored red in the search screen failed:
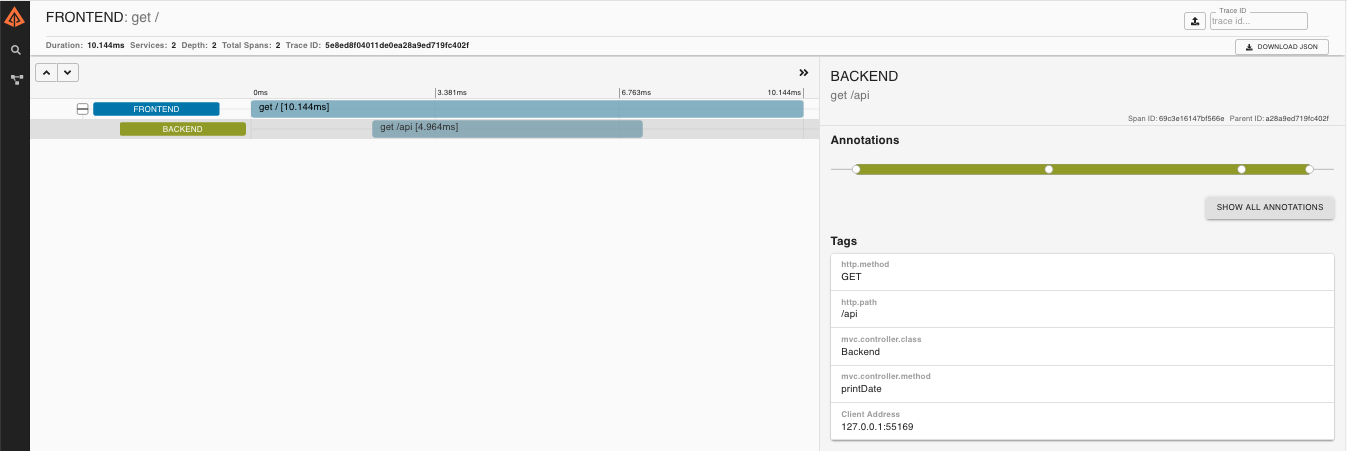
If you then click on one of the traces, you can understand if the failure happened before the request hit another service or not:
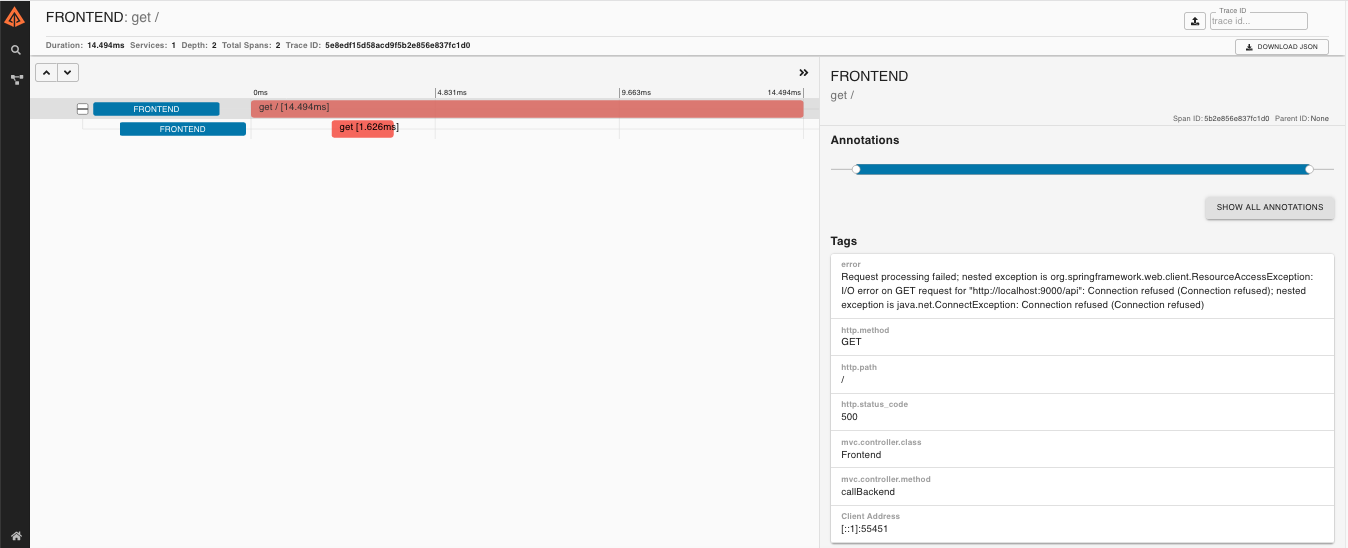
For example, the above error happened in the "backend" service, and caused the "frontend" service to fail.
2.2. Log correlation
Sleuth configures the logging context with variables including the service name
(%{spring.zipkin.service.name}) and the trace ID (%{traceId}). These help
you connect logs with distributed traces and allow you choice in what tools you
use to troubleshoot your services.
Once you find any log with an error, you can look for the trace ID in the message. Paste that into Zipkin to visualize the entire trace, regardless of how many services the first request ended up hitting.
backend.log:  2020-04-09 17:45:40.516 ERROR [backend,5e8eeec48b08e26882aba313eb08f0a4,dcc1df555b5777b3,true] 97203 --- [nio-9000-exec-1] o.s.c.s.i.web.ExceptionLoggingFilter     : Uncaught exception thrown
frontend.log:2020-04-09 17:45:40.574 ERROR [frontend,5e8eeec48b08e26882aba313eb08f0a4,82aba313eb08f0a4,true] 97192 --- [nio-8081-exec-2] o.s.c.s.i.web.ExceptionLoggingFilter     : Uncaught exception thrown
Above, you’ll notice the trace ID is 5e8eeec48b08e26882aba313eb08f0a4, for
example. This log configuration was automatically setup by Sleuth.
2.3. Service Dependency Graph
When you consider distributed tracing tracks requests, it makes sense that trace data can paint a picture of your architecture.
Zipkin includes a tool to build service dependency diagrams from traces, including the count of calls and how many errors exist.
The example application will make a simple diagram like this, but your real environment diagram may be more complex. image::https://raw.githubusercontent.com/spring-cloud/spring-cloud-sleuth/master/docs/src/main/asciidoc/images/zipkin-dependencies.png[Zipkin Dependencies]
Note: Production environments will generate a lot of data. You will likely need to run a separate service to aggregate the dependency graph. You can learn more here.
2.4. Request scoped properties (Baggage)
Distributed tracing works by propagating fields inside and across services that connect the trace together: traceId and spanId notably. The context that holds these fields can optionally push other fields that need to be consistent regardless of many services are touched. The simple name for these extra fields is "Baggage".
Sleuth allows you to define which baggage are permitted to exist in the trace context, including what header names are used.
The following example shows setting baggage values:
Span initialSpan = this.tracer.nextSpan().name("span").start();
BUSINESS_PROCESS.updateValue(initialSpan.context(), "ALM");
COUNTRY_CODE.updateValue(initialSpan.context(), "FO");| There is currently no limitation of the count or size of baggage items. Keep in mind that too many can decrease system throughput or increase RPC latency. In extreme cases, too much baggage can crash the application, due to exceeding transport-level message or header capacity. |
2.4.1. Baggage versus Tags
Like trace IDs, Baggage is attached to messages or requests, usually as headers. Tags are key value pairs sent in a Span to Zipkin. Baggage values are not added spans by default, which means you can’t search based on Baggage unless you opt-in.
To make baggage also tags, use the property spring.sleuth.baggage.tag-fields
like so:
spring:
  sleuth:
    baggage:
      foo: bar
      remoteFields:
        - country-code
        - x-vcap-request-id
      tagFields:
        - country-code
3. Adding Sleuth to your Project
This section addresses how to add Sleuth to your project with either Maven or Gradle.
To ensure that your application name is properly displayed in Zipkin, set the spring.application.name property in bootstrap.yml.
|
3.1. Sleuth with Zipkin via HTTP
If you want both Sleuth and Zipkin, add the spring-cloud-starter-zipkin dependency.
The following example shows how to do so for Maven:
<dependencyManagement> (1)
      <dependencies>
          <dependency>
              <groupId>org.springframework.cloud</groupId>
              <artifactId>spring-cloud-dependencies</artifactId>
              <version>${release.train.version}</version>
              <type>pom</type>
              <scope>import</scope>
          </dependency>
      </dependencies>
</dependencyManagement>

<dependency> (2)
    <groupId>org.springframework.cloud</groupId>
    <artifactId>spring-cloud-starter-zipkin</artifactId>
</dependency>| 1 | We recommend that you add the dependency management through the Spring BOM so that you need not manage versions yourself. |
| 2 | Add the dependency to spring-cloud-starter-zipkin. |
The following example shows how to do so for Gradle:
dependencyManagement { (1)
    imports {
        mavenBom "org.springframework.cloud:spring-cloud-dependencies:${releaseTrainVersion}"
    }
}

dependencies { (2)
    compile "org.springframework.cloud:spring-cloud-starter-zipkin"
}| 1 | We recommend that you add the dependency management through the Spring BOM so that you need not manage versions yourself. |
| 2 | Add the dependency to spring-cloud-starter-zipkin. |
3.2. Sleuth with Zipkin over RabbitMQ or Kafka
If you want to use RabbitMQ or Kafka instead of HTTP, add the spring-rabbit or spring-kafka dependency.
The default destination name is zipkin.
If using Kafka, you must set the property spring.zipkin.sender.type property accordingly:
spring.zipkin.sender.type: kafka
spring-cloud-sleuth-stream is deprecated and incompatible with these destinations.
|
If you want Sleuth over RabbitMQ, add the spring-cloud-starter-zipkin and spring-rabbit
dependencies.
The following example shows how to do so for Gradle:
<dependencyManagement> (1)
      <dependencies>
          <dependency>
              <groupId>org.springframework.cloud</groupId>
              <artifactId>spring-cloud-dependencies</artifactId>
              <version>${release.train.version}</version>
              <type>pom</type>
              <scope>import</scope>
          </dependency>
      </dependencies>
</dependencyManagement>

<dependency> (2)
    <groupId>org.springframework.cloud</groupId>
    <artifactId>spring-cloud-starter-zipkin</artifactId>
</dependency>
<dependency> (3)
    <groupId>org.springframework.amqp</groupId>
    <artifactId>spring-rabbit</artifactId>
</dependency>| 1 | We recommend that you add the dependency management through the Spring BOM so that you need not manage versions yourself. |
| 2 | Add the dependency to spring-cloud-starter-zipkin. That way, all nested dependencies get downloaded. |
| 3 | To automatically configure RabbitMQ, add the spring-rabbit dependency. |
dependencyManagement { (1)
    imports {
        mavenBom "org.springframework.cloud:spring-cloud-dependencies:${releaseTrainVersion}"
    }
}

dependencies {
    compile "org.springframework.cloud:spring-cloud-starter-zipkin" (2)
    compile "org.springframework.amqp:spring-rabbit" (3)
}| 1 | We recommend that you add the dependency management through the Spring BOM so that you need not manage versions yourself. |
| 2 | Add the dependency to spring-cloud-starter-zipkin. That way, all nested dependencies get downloaded. |
| 3 | To automatically configure RabbitMQ, add the spring-rabbit dependency. |
3.3. Overriding the auto-configuration of Zipkin
Spring Cloud Sleuth supports sending traces to multiple tracing systems as of version 2.1.0.
In order to get this to work, every tracing system needs to have a Reporter<Span> and Sender.
If you want to override the provided beans you need to give them a specific name.
To do this you can use respectively ZipkinAutoConfiguration.REPORTER_BEAN_NAME and ZipkinAutoConfiguration.SENDER_BEAN_NAME.
@Configuration
protected static class MyConfig {

    @Bean(ZipkinAutoConfiguration.REPORTER_BEAN_NAME)
    Reporter<zipkin2.Span> myReporter() {
        return AsyncReporter.create(mySender());
    }

    @Bean(ZipkinAutoConfiguration.SENDER_BEAN_NAME)
    MySender mySender() {
        return new MySender();
    }

    static class MySender extends Sender {

        private boolean spanSent = false;

        boolean isSpanSent() {
            return this.spanSent;
        }

        @Override
        public Encoding encoding() {
            return Encoding.JSON;
        }

        @Override
        public int messageMaxBytes() {
            return Integer.MAX_VALUE;
        }

        @Override
        public int messageSizeInBytes(List<byte[]> encodedSpans) {
            return encoding().listSizeInBytes(encodedSpans);
        }

        @Override
        public Call<Void> sendSpans(List<byte[]> encodedSpans) {
            this.spanSent = true;
            return Call.create(null);
        }

    }

}
3.4. Only Sleuth (log correlation)
If you want to use only Spring Cloud Sleuth without the Zipkin integration, add the spring-cloud-starter-sleuth module to your project.
The following example shows how to add Sleuth with Maven:
<dependencyManagement> (1)
      <dependencies>
          <dependency>
              <groupId>org.springframework.cloud</groupId>
              <artifactId>spring-cloud-dependencies</artifactId>
              <version>${release.train.version}</version>
              <type>pom</type>
              <scope>import</scope>
          </dependency>
      </dependencies>
</dependencyManagement>

<dependency> (2)
    <groupId>org.springframework.cloud</groupId>
    <artifactId>spring-cloud-starter-sleuth</artifactId>
</dependency>| 1 | We recommend that you add the dependency management through the Spring BOM so that you need not manage versions yourself. |
| 2 | Add the dependency to spring-cloud-starter-sleuth. |
The following example shows how to add Sleuth with Gradle:
dependencyManagement { (1)
    imports {
        mavenBom "org.springframework.cloud:spring-cloud-dependencies:${releaseTrainVersion}"
    }
}

dependencies { (2)
    compile "org.springframework.cloud:spring-cloud-starter-sleuth"
}| 1 | We recommend that you add the dependency management through the Spring BOM so that you need not manage versions yourself. |
| 2 | Add the dependency to spring-cloud-starter-sleuth. |
4. How Sleuth works
Spring Cloud Sleuth is a layer over Brave.
Brave is a distributed tracing instrumentation library. Brave typically intercepts production requests to gather timing data, correlate and propagate trace contexts.
Trace data, also called spans, are typically reported to Zipkin. Zipkin is an Open Source tracing system, which includes a UI and various collectors, such as HTTP and messaging.
Many Open Source and commercial products accept Zipkin format. Some options are documented here, but many are not. If you cannot use Zipkin and your product isn’t listed, clarify with your support representative and have them update that page. In many cases, products already support Zipkin format, they just don’t document it.
Traces connect from service to service using header propagation. The default format is B3. Similar to data formats, you can configure alternate header formats also, provided trace and span IDs are compatible with B3. Most notably, this means the trace ID and span IDs are lower-case hex, not UUIDs. Besides trace identifiers, other properties (Baggage) can also be passed along with the request. Remote Baggage must be predefined, but is flexible otherwise.
Sleuth configures everything you need to get started with tracing. Sleuth configures where trace data (spans) are reported to, how many traces to keep (sampling), if remote fields (baggage) are sent, and which libraries are traced. Sleuth also adds annotation based tracing features and some instrumentation not available otherwise, such as Reactor. If cannot find the configuration you are looking for in the documentation, ask Gitter before assuming something cannot be done.
4.1. Brave Basics
Most instrumentation work is done for you by default. Sleuth provides beans to allow you to change what’s traced, and it even provides annotations to avoid using tracing libraries! All of this is explained later in this document.
That said, you might want to know more about how things work underneath. Here are some pointers.
Here are the most core types you might use:
* SpanCustomizer - to change the span currently in progress
* Tracer - to get a start new spans ad-hoc
Here are the most relevant links from the OpenZipkin Brave project: * [Brave’s core library](github.com/openzipkin/brave/tree/master/brave) * [Baggage (propagated fields)](github.com/openzipkin/brave/tree/master/brave#baggage) * [HTTP tracing](github.com/openzipkin/brave/tree/master/instrumentation/http)
5. Sampling
Sampling only applies to tracing backends, such as Zipkin. Trace IDs appear in logs regardless of sample rate. Sampling is a way to prevent overloading the system, by consistently tracing some, but not all requests.
The default rate of 10 traces per second is controlled by the spring.sleuth.sampler.rate
property and applies when we know Sleuth is used for reasons besides logging. Use a rate above 100
traces per second with extreme caution as it can overload your tracing system.
The sampler can be set by Java Config also, as shown in the following example:
@Bean
public Sampler defaultSampler() {
    return Sampler.ALWAYS_SAMPLE;
}
You can set the HTTP header b3 to 1, or, when doing messaging, you can set the spanFlags header to 1.
Doing so forces the current request to be sampled regardless of configuration.
|
6. Baggage
Baggage are fields that are propagated with the trace, optionally out of process. You can use properties to define fields that have no special configuration such as name mapping:
-
spring.sleuth.baggage.remote-fieldsis a list of header names to accept and propagate to remote services. -
spring.sleuth.baggage.local-fieldsis a list of names to propagate locally
No prefixing applies with these keys. What you set is literally what is used.
A name set in either of these properties will result in a BaggageField of the same name.
In order to automatically set the baggage values to Slf4j’s MDC, you have to set
the spring.sleuth.baggage.correlation-fields property with a list of whitelisted
local or remote keys. E.g. spring.sleuth.baggage.correlation-fields=country-code will set the
value of the country-code baggage into MDC.
| Remember that adding entries to MDC can drastically decrease the performance of your application! |
If you want to add the baggage entries as tags, to make it possible to search for spans via the baggage entries, you can set the value of
spring.sleuth.baggage.tag-fields with a list of whitelisted baggage keys. To disable the feature you have to pass the spring.sleuth.propagation.tag.enabled=false property.
6.1. Java configuration
If you need to do anything more advanced than above, do not define properties and instead use a
@Bean config for the baggage fields you use.
* BaggagePropagationCustomizer sets up baggage fields
* Add a SingleBaggageField to control header names for a BaggageField.
* CorrelationScopeCustomizer sets up MDC fields
* Add a SingleCorrelationField to change the MDC name of a BaggageField or if updates flush.
7. Instrumentation
Spring Cloud Sleuth automatically instruments all your Spring applications, so you should not have to do anything to activate it.
The instrumentation is added by using a variety of technologies according to the stack that is available. For example, for a servlet web application, we use a Filter, and, for Spring Integration, we use ChannelInterceptors.
You can customize the keys used in span tags.
To limit the volume of span data, an HTTP request is, by default, tagged only with a handful of metadata, such as the status code, the host, and the URL.
You can add request headers by configuring spring.sleuth.keys.http.headers (a list of header names).
Tags are collected and exported only if there is a Sampler that allows it. By default, there is no such Sampler, to ensure that there is no danger of accidentally collecting too much data without configuring something).
|
8. Span lifecycle
You can do the following operations on the Span by means of brave.Tracer:
-
start: When you start a span, its name is assigned and the start timestamp is recorded.
-
close: The span gets finished (the end time of the span is recorded) and, if the span is sampled, it is eligible for collection (for example, to Zipkin).
-
continue: A new instance of span is created. It is a copy of the one that it continues.
-
detach: The span does not get stopped or closed. It only gets removed from the current thread.
-
create with explicit parent: You can create a new span and set an explicit parent for it.
Spring Cloud Sleuth creates an instance of Tracer for you. In order to use it, you can autowire it.
|
8.1. Creating and finishing spans
You can manually create spans by using the Tracer, as shown in the following example:
// Start a span. If there was a span present in this thread it will become
// the `newSpan`'s parent.
Span newSpan = this.tracer.nextSpan().name("calculateTax");
try (Tracer.SpanInScope ws = this.tracer.withSpanInScope(newSpan.start())) {
    // ...
    // You can tag a span
    newSpan.tag("taxValue", taxValue);
    // ...
    // You can log an event on a span
    newSpan.annotate("taxCalculated");
}
finally {
    // Once done remember to finish the span. This will allow collecting
    // the span to send it to Zipkin
    newSpan.finish();
}
In the preceding example, we could see how to create a new instance of the span. If there is already a span in this thread, it becomes the parent of the new span.
| Always clean after you create a span. Also, always finish any span that you want to send to Zipkin. |
| If your span contains a name greater than 50 chars, that name is truncated to 50 chars. Your names have to be explicit and concrete. Big names lead to latency issues and sometimes even exceptions. |
8.2. Continuing Spans
Sometimes, you do not want to create a new span but you want to continue one. An example of such a situation might be as follows:
-
AOP: If there was already a span created before an aspect was reached, you might not want to create a new span.
To continue a span, you can use brave.Tracer, as shown in the following example:
// let's assume that we're in a thread Y and we've received
// the `initialSpan` from thread X
Span continuedSpan = this.tracer.toSpan(newSpan.context());
try {
    // ...
    // You can tag a span
    continuedSpan.tag("taxValue", taxValue);
    // ...
    // You can log an event on a span
    continuedSpan.annotate("taxCalculated");
}
finally {
    // Once done remember to flush the span. That means that
    // it will get reported but the span itself is not yet finished
    continuedSpan.flush();
}
8.3. Creating a Span with an explicit Parent
You might want to start a new span and provide an explicit parent of that span.
Assume that the parent of a span is in one thread and you want to start a new span in another thread.
In Brave, whenever you call nextSpan(), it creates a span in reference to the span that is currently in scope.
You can put the span in scope and then call nextSpan(), as shown in the following example:
// let's assume that we're in a thread Y and we've received
// the `initialSpan` from thread X. `initialSpan` will be the parent
// of the `newSpan`
Span newSpan = null;
try (Tracer.SpanInScope ws = this.tracer.withSpanInScope(initialSpan)) {
    newSpan = this.tracer.nextSpan().name("calculateCommission");
    // ...
    // You can tag a span
    newSpan.tag("commissionValue", commissionValue);
    // ...
    // You can log an event on a span
    newSpan.annotate("commissionCalculated");
}
finally {
    // Once done remember to finish the span. This will allow collecting
    // the span to send it to Zipkin. The tags and events set on the
    // newSpan will not be present on the parent
    if (newSpan != null) {
        newSpan.finish();
    }
}| After creating such a span, you must finish it. Otherwise it is not reported (for example, to Zipkin). |
9. Naming spans
Picking a span name is not a trivial task. A span name should depict an operation name. The name should be low cardinality, so it should not include identifiers.
Since there is a lot of instrumentation going on, some span names are artificial:
-
controller-method-namewhen received by a Controller with a method name ofcontrollerMethodName -
asyncfor asynchronous operations done with wrappedCallableandRunnableinterfaces. -
Methods annotated with
@Scheduledreturn the simple name of the class.
Fortunately, for asynchronous processing, you can provide explicit naming.
9.1. @SpanName Annotation
You can name the span explicitly by using the @SpanName annotation, as shown in the following example:
@SpanName("calculateTax")
class TaxCountingRunnable implements Runnable {

    @Override
    public void run() {
        // perform logic
    }

}
In this case, when processed in the following manner, the span is named calculateTax:
Runnable runnable = new TraceRunnable(this.tracing, spanNamer,
        new TaxCountingRunnable());
Future<?> future = executorService.submit(runnable);
// ... some additional logic ...
future.get();
9.2. toString() method
It is pretty rare to create separate classes for Runnable or Callable.
Typically, one creates an anonymous instance of those classes.
You cannot annotate such classes.
To overcome that limitation, if there is no @SpanName annotation present, we check whether the class has a custom implementation of the toString() method.
Running such code leads to creating a span named calculateTax, as shown in the following example:
Runnable runnable = new TraceRunnable(this.tracing, spanNamer, new Runnable() {
    @Override
    public void run() {
        // perform logic
    }

    @Override
    public String toString() {
        return "calculateTax";
    }
});
Future<?> future = executorService.submit(runnable);
// ... some additional logic ...
future.get();
10. Managing Spans with Annotations
You can manage spans with a variety of annotations.
10.1. Rationale
There are a number of good reasons to manage spans with annotations, including:
-
API-agnostic means to collaborate with a span. Use of annotations lets users add to a span with no library dependency on a span api. Doing so lets Sleuth change its core API to create less impact to user code.
-
Reduced surface area for basic span operations. Without this feature, you must use the span api, which has lifecycle commands that could be used incorrectly. By only exposing scope, tag, and log functionality, you can collaborate without accidentally breaking span lifecycle.
-
Collaboration with runtime generated code. With libraries such as Spring Data and Feign, the implementations of interfaces are generated at runtime. Consequently, span wrapping of objects was tedious. Now you can provide annotations over interfaces and the arguments of those interfaces.
10.2. Creating New Spans
If you do not want to create local spans manually, you can use the @NewSpan annotation.
Also, we provide the @SpanTag annotation to add tags in an automated fashion.
Now we can consider some examples of usage.
@NewSpan
void testMethod();
Annotating the method without any parameter leads to creating a new span whose name equals the annotated method name.
@NewSpan("customNameOnTestMethod4")
void testMethod4();
If you provide the value in the annotation (either directly or by setting the name parameter), the created span has the provided value as the name.
// method declaration
@NewSpan(name = "customNameOnTestMethod5")
void testMethod5(@SpanTag("testTag") String param);

// and method execution
this.testBean.testMethod5("test");
You can combine both the name and a tag. Let’s focus on the latter.
In this case, the value of the annotated method’s parameter runtime value becomes the value of the tag.
In our sample, the tag key is testTag, and the tag value is test.
@NewSpan(name = "customNameOnTestMethod3")
@Override
public void testMethod3() {
}
You can place the @NewSpan annotation on both the class and an interface.
If you override the interface’s method and provide a different value for the @NewSpan annotation, the most
concrete one wins (in this case customNameOnTestMethod3 is set).
10.3. Continuing Spans
If you want to add tags and annotations to an existing span, you can use the @ContinueSpan annotation, as shown in the following example:
// method declaration
@ContinueSpan(log = "testMethod11")
void testMethod11(@SpanTag("testTag11") String param);

// method execution
this.testBean.testMethod11("test");
this.testBean.testMethod13();
(Note that, in contrast with the @NewSpan annotation ,you can also add logs with the log parameter.)
That way, the span gets continued and:
-
Log entries named
testMethod11.beforeandtestMethod11.afterare created. -
If an exception is thrown, a log entry named
testMethod11.afterFailureis also created. -
A tag with a key of
testTag11and a value oftestis created.
10.4. Advanced Tag Setting
There are 3 different ways to add tags to a span. All of them are controlled by the SpanTag annotation.
The precedence is as follows:
-
Try with a bean of
TagValueResolvertype and a provided name. -
If the bean name has not been provided, try to evaluate an expression. We search for a
TagValueExpressionResolverbean. The default implementation uses SPEL expression resolution. IMPORTANT You can only reference properties from the SPEL expression. Method execution is not allowed due to security constraints. -
If we do not find any expression to evaluate, return the
toString()value of the parameter.
10.4.1. Custom extractor
The value of the tag for the following method is computed by an implementation of TagValueResolver interface.
Its class name has to be passed as the value of the resolver attribute.
Consider the following annotated method:
@NewSpan
public void getAnnotationForTagValueResolver(
        @SpanTag(key = "test", resolver = TagValueResolver.class) String test) {
}
Now further consider the following TagValueResolver bean implementation:
@Bean(name = "myCustomTagValueResolver")
public TagValueResolver tagValueResolver() {
    return parameter -> "Value from myCustomTagValueResolver";
}
The two preceding examples lead to setting a tag value equal to Value from myCustomTagValueResolver.
10.4.2. Resolving Expressions for a Value
Consider the following annotated method:
@NewSpan
public void getAnnotationForTagValueExpression(@SpanTag(key = "test",
        expression = "'hello' + ' characters'") String test) {
}
No custom implementation of a TagValueExpressionResolver leads to evaluation of the SPEL expression, and a tag with a value of 4 characters is set on the span.
If you want to use some other expression resolution mechanism, you can create your own implementation of the bean.
10.4.3. Using the toString() method
Consider the following annotated method:
@NewSpan
public void getAnnotationForArgumentToString(@SpanTag("test") Long param) {
}
Running the preceding method with a value of 15 leads to setting a tag with a String value of "15".
11. Customizations
The Tracer object is fully managed by sleuth, so you rarely need to affect it. That said,
Sleuth supports a number of Customizer types, that allow you to configure
anything not already done by Sleuth with auto-configuration or properties.
If you define one of the following as a Bean, Sleuth will invoke it to
customize behaviour:
-
RpcTracingCustomizer - for RPC tagging and sampling policy
-
HttpTracingCustomizer - for HTTP tagging and sampling policy
-
MessagingTracingCustomizer - for messaging tagging and sampling policy
-
CurrentTraceContextCustomizer - to integrate decorators such as correlation.
-
BaggagePropagationCustomizer - for propagating baggage fields in process and over headers
-
CorrelationScopeDecoratorCustomizer - for scope decorations such as MDC (logging) field correlation
11.1. HTTP
11.1.1. Data Policy
The default span data policy for HTTP requests is described in Brave: github.com/openzipkin/brave/tree/master/instrumentation/http#span-data-policy
To add different data to the span, you need to register a bean of type
brave.http.HttpRequestParser or brave.http.HttpResponseParser based on when
the data is collected.
The bean names correspond to the request or response side, and whether it is
a client or server. For example, sleuthHttpClientRequestParser changes what
is collected before a client request is sent to the server.
For your convenience @HttpClientRequestParser, @HttpClientResponseParser
and corresponding server annotations can be used to inject the proper beans
or to reference the bean names via their static String NAME fields.
Here’s an example adding the HTTP url in addition to defaults:
@Configuration
class Config {
  @Bean(name = { HttpClientRequestParser.NAME, HttpServerRequestParser.NAME })
  HttpRequestParser sleuthHttpServerRequestParser() {
      return (req, context, span) -> {
          HttpRequestParser.DEFAULT.parse(req, context, span);
          String url = req.url();
          if (url != null) {
              span.tag("http.url", url);
          }
      };
  }
}
11.1.2. Sampling
If client /server sampling is required, just register a bean of type
brave.sampler.SamplerFunction<HttpRequest> and name the bean
sleuthHttpClientSampler for client sampler and sleuthHttpServerSampler
for server sampler.
For your convenience the @HttpClientSampler and @HttpServerSampler
annotations can be used to inject the proper beans or to reference the bean
names via their static String NAME fields.
Check out Brave’s code to see an example of how to make a path-based sampler github.com/openzipkin/brave/tree/master/instrumentation/http#sampling-policy
If you want to completely rewrite the HttpTracing bean you can use the SkipPatternProvider
interface to retrieve the URL Pattern for spans that should be not sampled. Below you can see
an example of usage of SkipPatternProvider inside a server side, Sampler<HttpRequest>.
@Configuration
class Config {
  @Bean(name = HttpServerSampler.NAME)
  SamplerFunction<HttpRequest> myHttpSampler(SkipPatternProvider provider) {
      Pattern pattern = provider.skipPattern();
      return request -> {
          String url = request.path();
          boolean shouldSkip = pattern.matcher(url).matches();
          if (shouldSkip) {
              return false;
          }
          return null;
      };
  }
}
11.2. TracingFilter
You can also modify the behavior of the TracingFilter, which is the component that is responsible for processing the input HTTP request and adding tags basing on the HTTP response.
You can customize the tags or modify the response headers by registering your own instance of the TracingFilter bean.
In the following example, we register the TracingFilter bean, add the ZIPKIN-TRACE-ID response header containing the current Span’s trace id, and add a tag with key custom and a value tag to the span.
@Component
@Order(TraceWebServletAutoConfiguration.TRACING_FILTER_ORDER + 1)
class MyFilter extends GenericFilterBean {

    private final Tracer tracer;

    MyFilter(Tracer tracer) {
        this.tracer = tracer;
    }

    @Override
    public void doFilter(ServletRequest request, ServletResponse response,
            FilterChain chain) throws IOException, ServletException {
        Span currentSpan = this.tracer.currentSpan();
        if (currentSpan == null) {
            chain.doFilter(request, response);
            return;
        }
        // for readability we're returning trace id in a hex form
        ((HttpServletResponse) response).addHeader("ZIPKIN-TRACE-ID",
                currentSpan.context().traceIdString());
        // we can also add some custom tags
        currentSpan.tag("custom", "tag");
        chain.doFilter(request, response);
    }

}
11.3. Messaging
Sleuth automatically configures the MessagingTracing bean which serves as a
foundation for Messaging instrumentation such as Kafka or JMS.
If a customization of producer / consumer sampling of messaging traces is required,
just register a bean of type brave.sampler.SamplerFunction<MessagingRequest> and
name the bean sleuthProducerSampler for producer sampler and sleuthConsumerSampler
for consumer sampler.
For your convenience the @ProducerSampler and @ConsumerSampler
annotations can be used to inject the proper beans or to reference the bean
names via their static String NAME fields.
Ex. Here’s a sampler that traces 100 consumer requests per second, except for
the "alerts" channel. Other requests will use a global rate provided by the
Tracing component.
@Configuration
class Config {
}11.4. RPC
Sleuth automatically configures the RpcTracing bean which serves as a
foundation for RPC instrumentation such as gRPC or Dubbo.
If a customization of client / server sampling of the RPC traces is required,
just register a bean of type brave.sampler.SamplerFunction<RpcRequest> and
name the bean sleuthRpcClientSampler for client sampler and
sleuthRpcServerSampler for server sampler.
For your convenience the @RpcClientSampler and @RpcServerSampler
annotations can be used to inject the proper beans or to reference the bean
names via their static String NAME fields.
Ex. Here’s a sampler that traces 100 "GetUserToken" server requests per second. This doesn’t start new traces for requests to the health check service. Other requests will use the global sampling configuration.
@Configuration
class Config {
  @Bean(name = RpcServerSampler.NAME)
  SamplerFunction<RpcRequest> myRpcSampler() {
      Matcher<RpcRequest> userAuth = and(serviceEquals("users.UserService"),
              methodEquals("GetUserToken"));
      return RpcRuleSampler.newBuilder()
              .putRule(serviceEquals("grpc.health.v1.Health"), Sampler.NEVER_SAMPLE)
              .putRule(userAuth, RateLimitingSampler.create(100)).build();
  }
}11.5. Custom service name
By default, Sleuth assumes that, when you send a span to Zipkin, you want the span’s service name to be equal to the value of the spring.application.name property.
That is not always the case, though.
There are situations in which you want to explicitly provide a different service name for all spans coming from your application.
To achieve that, you can pass the following property to your application to override that value (the example is for a service named myService):
spring.zipkin.service.name: myService11.6. Customization of Reported Spans
Before reporting spans (for example, to Zipkin) you may want to modify that span in some way.
You can do so by implementing a SpanHandler.
In Sleuth, we generate spans with a fixed name.
Some users want to modify the name depending on values of tags.
You can implement the SpanHandler interface to alter that name.
The following example shows how to register two beans that implement SpanHandler:
@Bean
SpanHandler handlerOne() {
    return new SpanHandler() {
        @Override
        public boolean end(TraceContext traceContext, MutableSpan span,
                Cause cause) {
            span.name("foo");
            return true; // keep this span
        }
    };
}

@Bean
SpanHandler handlerTwo() {
    return new SpanHandler() {
        @Override
        public boolean end(TraceContext traceContext, MutableSpan span,
                Cause cause) {
            span.name(span.name() + " bar");
            return true; // keep this span
        }
    };
}
The preceding example results in changing the name of the reported span to foo bar, just before it gets reported (for example, to Zipkin).
11.7. Host Locator
| This section is about defining host from service discovery. It is NOT about finding Zipkin through service discovery. |
To define the host that corresponds to a particular span, we need to resolve the host name and port. The default approach is to take these values from server properties. If those are not set, we try to retrieve the host name from the network interfaces.
If you have the discovery client enabled and prefer to retrieve the host address from the registered instance in a service registry, you have to set the spring.zipkin.locator.discovery.enabled property (it is applicable for both HTTP-based and Stream-based span reporting), as follows:
spring.zipkin.locator.discovery.enabled: true12. Sending Spans to Zipkin
By default, if you add spring-cloud-starter-zipkin as a dependency to your project, when the span is closed, it is sent to Zipkin over HTTP.
The communication is asynchronous.
You can configure the URL by setting the spring.zipkin.baseUrl property, as follows:
spring.zipkin.baseUrl: https://192.168.99.100:9411/If you want to find Zipkin through service discovery, you can pass the Zipkin’s service ID inside the URL, as shown in the following example for zipkinserver service ID:
spring.zipkin.baseUrl: https://zipkinserver/To disable this feature just set spring.zipkin.discoveryClientEnabled to `false.
When the Discovery Client feature is enabled, Sleuth uses
LoadBalancerClient to find the URL of the Zipkin Server. It means
that you can set up the load balancing configuration e.g. via Ribbon.
zipkinserver:
  ribbon:
    ListOfServers: host1,host2
If you have web, rabbit, activemq or kafka together on the classpath, you might need to pick the means by which you would like to send spans to zipkin.
To do so, set web, rabbit, activemq or kafka to the spring.zipkin.sender.type property.
The following example shows setting the sender type for web:
spring.zipkin.sender.type: webTo customize the RestTemplate that sends spans to Zipkin via HTTP, you can register
the ZipkinRestTemplateCustomizer bean.
@Configuration
class MyConfig {
    @Bean ZipkinRestTemplateCustomizer myCustomizer() {
        return new ZipkinRestTemplateCustomizer() {
            @Override
            void customize(RestTemplate restTemplate) {
                // customize the RestTemplate
            }
        };
    }
}
If, however, you would like to control the full process of creating the RestTemplate
object, you will have to create a bean of zipkin2.reporter.Sender type.
    @Bean Sender myRestTemplateSender(ZipkinProperties zipkin,
            ZipkinRestTemplateCustomizer zipkinRestTemplateCustomizer) {
        RestTemplate restTemplate = mySuperCustomRestTemplate();
        zipkinRestTemplateCustomizer.customize(restTemplate);
        return myCustomSender(zipkin, restTemplate);
    }
13. Integrations
13.1. OpenTracing
Spring Cloud Sleuth is compatible with OpenTracing.
If you have OpenTracing on the classpath, we automatically register the OpenTracing Tracer bean.
If you wish to disable this, set spring.sleuth.opentracing.enabled to false
13.2. Runnable and Callable
If you wrap your logic in Runnable or Callable, you can wrap those classes in their Sleuth representative, as shown in the following example for Runnable:
Runnable runnable = new Runnable() {
    @Override
    public void run() {
        // do some work
    }

    @Override
    public String toString() {
        return "spanNameFromToStringMethod";
    }
};
// Manual `TraceRunnable` creation with explicit "calculateTax" Span name
Runnable traceRunnable = new TraceRunnable(this.tracing, spanNamer, runnable,
        "calculateTax");
// Wrapping `Runnable` with `Tracing`. That way the current span will be available
// in the thread of `Runnable`
Runnable traceRunnableFromTracer = this.tracing.currentTraceContext()
        .wrap(runnable);
The following example shows how to do so for Callable:
Callable<String> callable = new Callable<String>() {
    @Override
    public String call() throws Exception {
        return someLogic();
    }

    @Override
    public String toString() {
        return "spanNameFromToStringMethod";
    }
};
// Manual `TraceCallable` creation with explicit "calculateTax" Span name
Callable<String> traceCallable = new TraceCallable<>(this.tracing, spanNamer,
        callable, "calculateTax");
// Wrapping `Callable` with `Tracing`. That way the current span will be available
// in the thread of `Callable`
Callable<String> traceCallableFromTracer = this.tracing.currentTraceContext()
        .wrap(callable);
That way, you ensure that a new span is created and closed for each execution.
13.3. Spring Cloud CircuitBreaker
If you have Spring Cloud CircuitBreaker on the classpath, we will wrap the passed command Supplier and the fallback Function in its trace representations. In order to disable this instrumentation set spring.sleuth.circuitbreaker.enabled to false.
13.4. RxJava
We registering a custom RxJavaSchedulersHook that wraps all Action0 instances in their Sleuth representative, which is called TraceAction.
The hook either starts or continues a span, depending on whether tracing was already going on before the Action was scheduled.
To disable the custom RxJavaSchedulersHook, set the spring.sleuth.rxjava.schedulers.hook.enabled to false.
You can define a list of regular expressions for thread names for which you do not want spans to be created.
To do so, provide a comma-separated list of regular expressions in the spring.sleuth.rxjava.schedulers.ignoredthreads property.
| The suggest approach to reactive programming and Sleuth is to use the Reactor support. |
13.5. HTTP integration
Features from this section can be disabled by setting the spring.sleuth.web.enabled property with value equal to false.
13.5.1. HTTP Filter
Through the TracingFilter, all sampled incoming requests result in creation of a Span.
That Span’s name is http: + the path to which the request was sent.
For example, if the request was sent to /this/that then the name will be http:/this/that.
You can configure which URIs you would like to skip by setting the spring.sleuth.web.skipPattern property.
If you have ManagementServerProperties on classpath, its value of contextPath gets appended to the provided skip pattern.
If you want to reuse the Sleuth’s default skip patterns and just append your own, pass those patterns by using the spring.sleuth.web.additionalSkipPattern.
By default, all the spring boot actuator endpoints are automatically added to the skip pattern.
If you want to disable this behaviour set spring.sleuth.web.ignore-auto-configured-skip-patterns
to true.
To change the order of tracing filter registration, please set the
spring.sleuth.web.filter-order property.
To disable the filter that logs uncaught exceptions you can disable the
spring.sleuth.web.exception-throwing-filter-enabled property.
13.5.2. HandlerInterceptor
Since we want the span names to be precise, we use a TraceHandlerInterceptor that either wraps an existing HandlerInterceptor or is added directly to the list of existing HandlerInterceptors.
The TraceHandlerInterceptor adds a special request attribute to the given HttpServletRequest.
If the the TracingFilter does not see this attribute, it creates a "fallback" span, which is an additional span created on the server side so that the trace is presented properly in the UI.
If that happens, there is probably missing instrumentation.
In that case, please file an issue in Spring Cloud Sleuth.
13.5.3. Async Servlet support
If your controller returns a Callable or a WebAsyncTask, Spring Cloud Sleuth continues the existing span instead of creating a new one.
13.5.4. WebFlux support
Through TraceWebFilter, all sampled incoming requests result in creation of a Span.
That Span’s name is http: + the path to which the request was sent.
For example, if the request was sent to /this/that, the name is http:/this/that.
You can configure which URIs you would like to skip by using the spring.sleuth.web.skipPattern property.
If you have ManagementServerProperties on the classpath, its value of contextPath gets appended to the provided skip pattern.
If you want to reuse Sleuth’s default skip patterns and append your own, pass those patterns by using the spring.sleuth.web.additionalSkipPattern.
To change the order of tracing filter registration, please set the
spring.sleuth.web.filter-order property.
13.5.5. Dubbo RPC support
Via the integration with Brave, Spring Cloud Sleuth supports Dubbo.
It’s enough to add the brave-instrumentation-dubbo dependency:
<dependency>
    <groupId>io.zipkin.brave</groupId>
    <artifactId>brave-instrumentation-dubbo</artifactId>
</dependency>
You need to also set a dubbo.properties file with the following contents:
dubbo.provider.filter=tracing
dubbo.consumer.filter=tracing13.6. HTTP Client Integration
13.6.1. Synchronous Rest Template
We inject a RestTemplate interceptor to ensure that all the tracing information is passed to the requests.
Each time a call is made, a new Span is created.
It gets closed upon receiving the response.
To block the synchronous RestTemplate features, set spring.sleuth.web.client.enabled to false.
You have to register RestTemplate as a bean so that the interceptors get injected.
If you create a RestTemplate instance with a new keyword, the instrumentation does NOT work.
|
13.6.2. Asynchronous Rest Template
Starting with Sleuth 2.0.0, we no longer register a bean of AsyncRestTemplate type.
It is up to you to create such a bean.
Then we instrument it.
|
To block the AsyncRestTemplate features, set spring.sleuth.web.async.client.enabled to false.
To disable creation of the default TraceAsyncClientHttpRequestFactoryWrapper, set spring.sleuth.web.async.client.factory.enabled
to false.
If you do not want to create AsyncRestClient at all, set spring.sleuth.web.async.client.template.enabled to false.
Multiple Asynchronous Rest Templates
Sometimes you need to use multiple implementations of the Asynchronous Rest Template.
In the following snippet, you can see an example of how to set up such a custom AsyncRestTemplate:
@Configuration
@EnableAutoConfiguration
static class Config {

    @Bean(name = "customAsyncRestTemplate")
    public AsyncRestTemplate traceAsyncRestTemplate() {
        return new AsyncRestTemplate(asyncClientFactory(),
                clientHttpRequestFactory());
    }

    private ClientHttpRequestFactory clientHttpRequestFactory() {
        ClientHttpRequestFactory clientHttpRequestFactory = new CustomClientHttpRequestFactory();
        // CUSTOMIZE HERE
        return clientHttpRequestFactory;
    }

    private AsyncClientHttpRequestFactory asyncClientFactory() {
        AsyncClientHttpRequestFactory factory = new CustomAsyncClientHttpRequestFactory();
        // CUSTOMIZE HERE
        return factory;
    }

}
13.6.3. WebClient
We inject a ExchangeFilterFunction implementation that creates a span and, through on-success and on-error callbacks, takes care of closing client-side spans.
To block this feature, set spring.sleuth.web.client.enabled to false.
You have to register WebClient as a bean so that the tracing instrumentation gets applied.
If you create a WebClient instance with a new keyword, the instrumentation does NOT work.
|
13.6.4. Traverson
If you use the Traverson library, you can inject a RestTemplate as a bean into your Traverson object.
Since RestTemplate is already intercepted, you get full support for tracing in your client. The following pseudo code
shows how to do that:
@Autowired RestTemplate restTemplate;

Traverson traverson = new Traverson(URI.create("https://some/address"),
    MediaType.APPLICATION_JSON, MediaType.APPLICATION_JSON_UTF8).setRestOperations(restTemplate);
// use Traverson
13.6.5. Apache HttpClientBuilder and HttpAsyncClientBuilder
We instrument the HttpClientBuilder and HttpAsyncClientBuilder so that
tracing context gets injected to the sent requests.
To block these features, set spring.sleuth.web.client.enabled to false.
13.6.6. Netty HttpClient
We instrument the Netty’s HttpClient.
To block this feature, set spring.sleuth.web.client.enabled to false.
You have to register HttpClient as a bean so that the instrumentation happens.
If you create a HttpClient instance with a new keyword, the instrumentation does NOT work.
|
13.6.7. UserInfoRestTemplateCustomizer
We instrument the Spring Security’s UserInfoRestTemplateCustomizer.
To block this feature, set spring.sleuth.web.client.enabled to false.
13.7. Feign
By default, Spring Cloud Sleuth provides integration with Feign through TraceFeignClientAutoConfiguration.
You can disable it entirely by setting spring.sleuth.feign.enabled to false.
If you do so, no Feign-related instrumentation take place.
Part of Feign instrumentation is done through a FeignBeanPostProcessor.
You can disable it by setting spring.sleuth.feign.processor.enabled to false.
If you set it to false, Spring Cloud Sleuth does not instrument any of your custom Feign components.
However, all the default instrumentation is still there.
13.8. gRPC
Spring Cloud Sleuth provides instrumentation for gRPC through TraceGrpcAutoConfiguration. You can disable it entirely by setting spring.sleuth.grpc.enabled to false.
13.8.1. Variant 1
Dependencies
| The gRPC integration relies on two external libraries to instrument clients and servers and both of those libraries must be on the class path to enable the instrumentation. |
Maven:
        <dependency>
            <groupId>io.github.lognet</groupId>
            <artifactId>grpc-spring-boot-starter</artifactId>
        </dependency>
        <dependency>
            <groupId>io.zipkin.brave</groupId>
            <artifactId>brave-instrumentation-grpc</artifactId>
        </dependency>
Gradle:
    compile("io.github.lognet:grpc-spring-boot-starter")
    compile("io.zipkin.brave:brave-instrumentation-grpc")
Server Instrumentation
Spring Cloud Sleuth leverages grpc-spring-boot-starter to register Brave’s gRPC server interceptor with all services annotated with @GRpcService.
Client Instrumentation
gRPC clients leverage a ManagedChannelBuilder to construct a ManagedChannel used to communicate to the gRPC server. The native ManagedChannelBuilder provides static methods as entry points for construction of ManagedChannel instances, however, this mechanism is outside the influence of the Spring application context.
Spring Cloud Sleuth provides a SpringAwareManagedChannelBuilder that can be customized through the Spring application context and injected by gRPC clients. This builder must be used when creating ManagedChannel instances.
|
Sleuth creates a TracingManagedChannelBuilderCustomizer which inject Brave’s client interceptor into the SpringAwareManagedChannelBuilder.
13.8.2. Variant 2
Grpc Spring Boot Starter automatically detects the presence of Spring Cloud Sleuth and brave’s instrumentation for gRPC and registers the necessary client and/or server tooling.
13.9. Asynchronous Communication
13.9.1. @Async Annotated methods
In Spring Cloud Sleuth, we instrument async-related components so that the tracing information is passed between threads.
You can disable this behavior by setting the value of spring.sleuth.async.enabled to false.
If you annotate your method with @Async, we automatically create a new Span with the following characteristics:
-
If the method is annotated with
@SpanName, the value of the annotation is the Span’s name. -
If the method is not annotated with
@SpanName, the Span name is the annotated method name. -
The span is tagged with the method’s class name and method name.
13.9.2. @Scheduled Annotated Methods
In Spring Cloud Sleuth, we instrument scheduled method execution so that the tracing information is passed between threads.
You can disable this behavior by setting the value of spring.sleuth.scheduled.enabled to false.
If you annotate your method with @Scheduled, we automatically create a new span with the following characteristics:
-
The span name is the annotated method name.
-
The span is tagged with the method’s class name and method name.
If you want to skip span creation for some @Scheduled annotated classes, you can set the spring.sleuth.scheduled.skipPattern with a regular expression that matches the fully qualified name of the @Scheduled annotated class.
13.9.3. Executor, ExecutorService, and ScheduledExecutorService
We provide LazyTraceExecutor, TraceableExecutorService, and TraceableScheduledExecutorService. Those implementations create spans each time a new task is submitted, invoked, or scheduled.
The following example shows how to pass tracing information with TraceableExecutorService when working with CompletableFuture:
CompletableFuture<Long> completableFuture = CompletableFuture.supplyAsync(() -> {
    // perform some logic
    return 1_000_000L;
}, new TraceableExecutorService(beanFactory, executorService,
        // 'calculateTax' explicitly names the span - this param is optional
        "calculateTax"));
Sleuth does not work with parallelStream() out of the box.
If you want to have the tracing information propagated through the stream, you have to use the approach with supplyAsync(...), as shown earlier.
|
If there are beans that implement the Executor interface that you would like
to exclude from span creation, you can use the spring.sleuth.async.ignored-beans
property where you can provide a list of bean names.
Customization of Executors
Sometimes, you need to set up a custom instance of the AsyncExecutor.
The following example shows how to set up such a custom Executor:
@Configuration
@EnableAutoConfiguration
@EnableAsync
// add the infrastructure role to ensure that the bean gets auto-proxied
@Role(BeanDefinition.ROLE_INFRASTRUCTURE)
static class CustomExecutorConfig extends AsyncConfigurerSupport {

    @Autowired
    BeanFactory beanFactory;

    @Override
    public Executor getAsyncExecutor() {
        ThreadPoolTaskExecutor executor = new ThreadPoolTaskExecutor();
        // CUSTOMIZE HERE
        executor.setCorePoolSize(7);
        executor.setMaxPoolSize(42);
        executor.setQueueCapacity(11);
        executor.setThreadNamePrefix("MyExecutor-");
        // DON'T FORGET TO INITIALIZE
        executor.initialize();
        return new LazyTraceExecutor(this.beanFactory, executor);
    }

}
To ensure that your configuration gets post processed, remember
to add the @Role(BeanDefinition.ROLE_INFRASTRUCTURE) on your
@Configuration class
|
13.10. Messaging
Features from this section can be disabled by setting the spring.sleuth.messaging.enabled property with value equal to false.
13.10.1. Spring Integration and Spring Cloud Stream
Spring Cloud Sleuth integrates with Spring Integration.
It creates spans for publish and subscribe events.
To disable Spring Integration instrumentation, set spring.sleuth.integration.enabled to false.
You can provide the spring.sleuth.integration.patterns pattern to explicitly provide the names of channels that you want to include for tracing.
By default, all channels but hystrixStreamOutput channel are included.
When using the Executor to build a Spring Integration IntegrationFlow, you must use the untraced version of the Executor.
Decorating the Spring Integration Executor Channel with TraceableExecutorService causes the spans to be improperly closed.
|
If you want to customize the way tracing context is read from and written to message headers, it’s enough for you to register beans of types:
-
Propagation.Setter<MessageHeaderAccessor, String>- for writing headers to the message -
Propagation.Getter<MessageHeaderAccessor, String>- for reading headers from the message
13.10.2. Spring RabbitMq
We instrument the RabbitTemplate so that tracing headers get injected
into the message.
To block this feature, set spring.sleuth.messaging.rabbit.enabled to false.
13.10.3. Spring Kafka
We instrument the Spring Kafka’s ProducerFactory and ConsumerFactory
so that tracing headers get injected into the created Spring Kafka’s
Producer and Consumer.
To block this feature, set spring.sleuth.messaging.kafka.enabled to false.
13.10.4. Spring Kafka Streams
We instrument the KafkaStreams KafkaClientSupplier so that tracing headers
get injected into the Producer and Consumer`s. A `KafkaStreamsTracing bean
allows for further instrumentation through additional TransformerSupplier and
ProcessorSupplier methods.
To block this feature, set spring.sleuth.messaging.kafka.streams.enabled to false.
13.10.5. Spring JMS
We instrument the JmsTemplate so that tracing headers get injected
into the message. We also support @JmsListener annotated methods on the consumer side.
To block this feature, set spring.sleuth.messaging.jms.enabled to false.
| We don’t support baggage propagation for JMS |
13.10.6. Spring Cloud AWS Messaging SQS
We instrument @SqsListener which is provided by org.springframework.cloud:spring-cloud-aws-messaging
so that tracing headers get extracted from the message and a trace gets put into the context.
To block this feature, set spring.sleuth.messaging.sqs.enabled to false.
13.11. Redis
We set tracing property to Lettcue ClientResources instance to enable Brave tracing built in Lettuce .
To disable Redis support, set the spring.sleuth.redis.enabled property to false.
13.12. Quartz
We instrument quartz jobs by adding Job/Trigger listeners to the Quartz Scheduler.
To turn off this feature, set the spring.sleuth.quartz.enabled property to false.
13.13. Project Reactor
For projects depending on Project Reactor such as Spring Cloud Gateway, we suggest turning the spring.sleuth.reactor.decorate-on-each option to false. That way an increased performance gain should be observed in comparison to the standard instrumentation mechanism. What this option does is it will wrap decorate onLast operator instead of onEach which will result in creation of far fewer objects. The downside of this is that when Project Reactor will change threads, the trace propagation will continue without issues, however anything relying on the ThreadLocal such as e.g. MDC entries can be buggy.
14. Log integration
Sleuth configures the logging context with variables including the service name
(%{spring.zipkin.service.name}) and the trace ID (%{traceId}). These help
you connect logs with distributed traces and allow you choice in what tools you
use to troubleshoot your services.
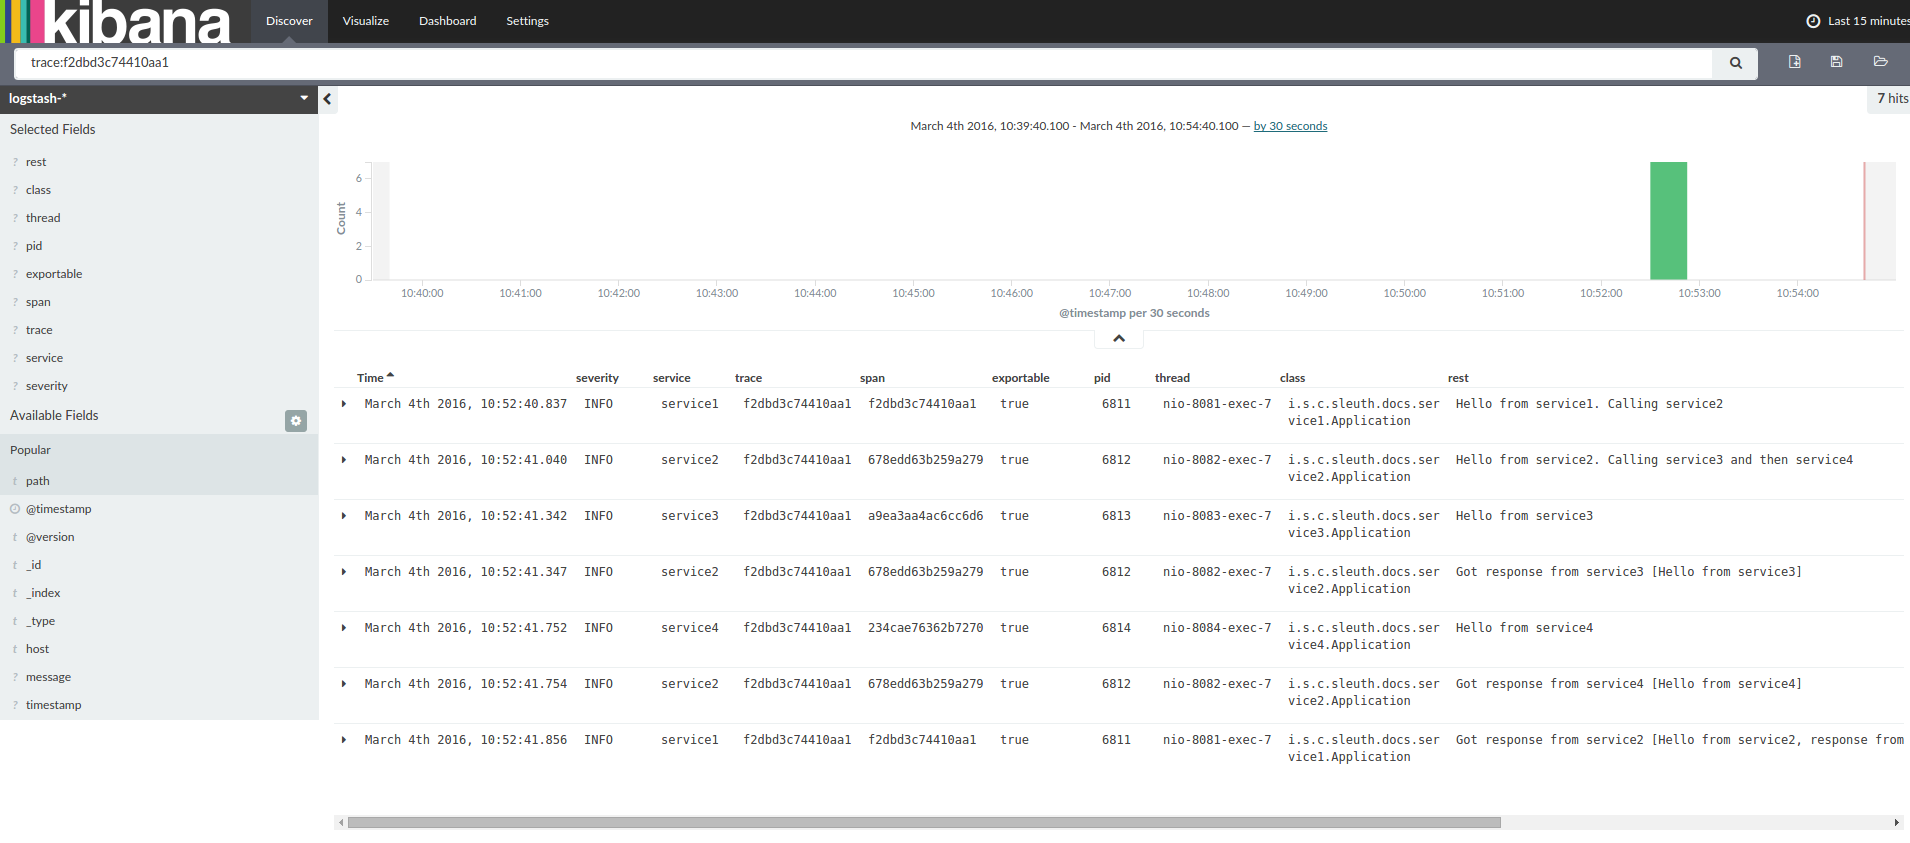
If you use a log aggregating tool (such as Kibana, Splunk, and others), you can order the events that took place. An example from Kibana would resemble the following image:
If you want to use Logstash, the following listing shows the Grok pattern for Logstash:
filter {
  # pattern matching logback pattern
  grok {
    match => { "message" => "%{TIMESTAMP_ISO8601:timestamp}\s+%{LOGLEVEL:severity}\s+\[%{DATA:service},%{DATA:trace},%{DATA:span}\]\s+%{DATA:pid}\s+---\s+\[%{DATA:thread}\]\s+%{DATA:class}\s+:\s+%{GREEDYDATA:rest}" }
  }
  date {
    match => ["timestamp", "ISO8601"]
  }
  mutate {
    remove_field => ["timestamp"]
  }
}| If you want to use Grok together with the logs from Cloud Foundry, you have to use the following pattern: |
filter {
  # pattern matching logback pattern
  grok {
    match => { "message" => "(?m)OUT\s+%{TIMESTAMP_ISO8601:timestamp}\s+%{LOGLEVEL:severity}\s+\[%{DATA:service},%{DATA:trace},%{DATA:span}\]\s+%{DATA:pid}\s+---\s+\[%{DATA:thread}\]\s+%{DATA:class}\s+:\s+%{GREEDYDATA:rest}" }
  }
  date {
    match => ["timestamp", "ISO8601"]
  }
  mutate {
    remove_field => ["timestamp"]
  }
}
14.1. JSON Logback with Logstash
Often, you do not want to store your logs in a text file but in a JSON file that Logstash can immediately pick.
To do so, you have to do the following (for readability, we pass the dependencies in the groupId:artifactId:version notation).
Dependencies Setup
-
Ensure that Logback is on the classpath (
ch.qos.logback:logback-core). -
Add Logstash Logback encode. For example, to use version
4.6, addnet.logstash.logback:logstash-logback-encoder:4.6.
Logback Setup
Consider the following example of a Logback configuration file (logback-spring.xml).
<?xml version="1.0" encoding="UTF-8"?>
<configuration>
    <include resource="org/springframework/boot/logging/logback/defaults.xml"/>
    <springProperty scope="context" name="springAppName" source="spring.application.name"/>
    <!-- Example for logging into the build folder of your project -->
    <property name="LOG_FILE" value="${BUILD_FOLDER:-build}/${springAppName}"/>

    <!-- You can override this to have a custom pattern -->
    <property name="CONSOLE_LOG_PATTERN"
              value="%clr(%d{yyyy-MM-dd HH:mm:ss.SSS}){faint} %clr(${LOG_LEVEL_PATTERN:-%5p}) %clr(${PID:- }){magenta} %clr(---){faint} %clr([%15.15t]){faint} %clr(%-40.40logger{39}){cyan} %clr(:){faint} %m%n${LOG_EXCEPTION_CONVERSION_WORD:-%wEx}"/>

    <!-- Appender to log to console -->
    <appender name="console" class="ch.qos.logback.core.ConsoleAppender">
        <filter class="ch.qos.logback.classic.filter.ThresholdFilter">
            <!-- Minimum logging level to be presented in the console logs-->
            <level>DEBUG</level>
        </filter>
        <encoder>
            <pattern>${CONSOLE_LOG_PATTERN}</pattern>
            <charset>utf8</charset>
        </encoder>
    </appender>

    <!-- Appender to log to file -->
    <appender name="flatfile" class="ch.qos.logback.core.rolling.RollingFileAppender">
        <file>${LOG_FILE}</file>
        <rollingPolicy class="ch.qos.logback.core.rolling.TimeBasedRollingPolicy">
            <fileNamePattern>${LOG_FILE}.%d{yyyy-MM-dd}.gz</fileNamePattern>
            <maxHistory>7</maxHistory>
        </rollingPolicy>
        <encoder>
            <pattern>${CONSOLE_LOG_PATTERN}</pattern>
            <charset>utf8</charset>
        </encoder>
    </appender>
    <!-- Appender to log to file in a JSON format -->
    <appender name="logstash" class="ch.qos.logback.core.rolling.RollingFileAppender">
        <file>${LOG_FILE}.json</file>
        <rollingPolicy class="ch.qos.logback.core.rolling.TimeBasedRollingPolicy">
            <fileNamePattern>${LOG_FILE}.json.%d{yyyy-MM-dd}.gz</fileNamePattern>
            <maxHistory>7</maxHistory>
        </rollingPolicy>
        <encoder class="net.logstash.logback.encoder.LoggingEventCompositeJsonEncoder">
            <providers>
                <timestamp>
                    <timeZone>UTC</timeZone>
                </timestamp>
                <pattern>
                    <pattern>
                        {
                        "timestamp": "@timestamp",
                        "severity": "%level",
                        "service": "${springAppName:-}",
                        "trace": "%X{traceId:-}",
                        "span": "%X{spanId:-}",
                        "pid": "${PID:-}",
                        "thread": "%thread",
                        "class": "%logger{40}",
                        "rest": "%message"
                        }
                    </pattern>
                </pattern>
            </providers>
        </encoder>
    </appender>
    <root level="INFO">
        <appender-ref ref="console"/>
        <!-- uncomment this to have also JSON logs -->
        <!--<appender-ref ref="logstash"/>-->
        <!--<appender-ref ref="flatfile"/>-->
    </root>
</configuration>
That Logback configuration file:
-
Logs information from the application in a JSON format to a
build/${spring.application.name}.jsonfile. -
Has commented out two additional appenders: console and standard log file.
-
Has the same logging pattern as the one presented in the previous section.
If you use a custom logback-spring.xml, you must pass the spring.application.name in the bootstrap rather than the application property file.
Otherwise, your custom logback file does not properly read the property.
|
15. Configuration properties
To see the list of all Sleuth related configuration properties please check the Appendix page.