This project provides Netflix OSS integrations for Spring Boot apps through autoconfiguration and binding to the Spring Environment and other Spring programming model idioms. With a few simple annotations you can quickly enable and configure the common patterns inside your application and build large distributed systems with battle-tested Netflix components. The patterns provided include Service Discovery (Eureka), Circuit Breaker (Hystrix), Intelligent Routing (Zuul) and Client Side Load Balancing (Ribbon).
Service Discovery: Eureka Clients
Service Discovery is one of the key tenets of a microservice based architecture. Trying to hand configure each client or some form of convention can be very difficult to do and can be very brittle. Eureka is the Netflix Service Discovery Server and Client. The server can be configured and deployed to be highly available, with each server replicating state about the registered services to the others.
Registering with Eureka
When a client registers with Eureka, it provides meta-data about itself such as host and port, health indicator URL, home page etc. Eureka receives heartbeat messages from each instance belonging to a service. If the heartbeat fails over a configurable timetable, the instance is normally removed from the registry.
Example eureka client:
@Configuration
@ComponentScan
@EnableAutoConfiguration
@EnableEurekaClient
@RestController
public class Application {

    @RequestMapping("/")
    public String home() {
        return "Hello world";
    }

    public static void main(String[] args) {
        new SpringApplicationBuilder(Application.class).web(true).run(args);
    }

}
(i.e. utterly normal Spring Boot app). In this example we use
@EnableEurekaClient explicitly, but with only Eureka available you
could also use @EnableDiscoveryClient. Configuration is required to
locate the Eureka server. Example:
eureka:
  client:
    serviceUrl:
      defaultZone: http://localhost:8761/eureka/
where "defaultZone" is a magic string fallback value that provides the service URL for any client that doesn’t express a preference (i.e. it’s a useful default).
The default application name (service ID), virtual host and non-secure
port, taken from the Environment, are ${spring.application.name},
${spring.application.name} and ${server.port} respectively.
@EnableEurekaClient makes the app into both a Eureka "instance"
(i.e. it registers itself) and a "client" (i.e. it can query the
registry to locate other services). The instance behaviour is driven
by eureka.instance.* configuration keys, but the defaults will be
fine if you ensure that your application has a
spring.application.name (this is the default for the Eureka service
ID, or VIP).
See EurekaInstanceConfigBean and EurekaClientConfigBean for more details of the configurable options.
Authenticating with the Eureka Server
HTTP basic authentication will be automatically added to your eureka
client if one of the eureka.client.serviceUrl.defaultZone URLs has
credentials embedded in it (curl style, like
http://user:password@localhost:8761/eureka). For more complex needs
you can create a @Bean of type DiscoveryClientOptionalArgs and
inject ClientFilter instances into it, all of which will be applied
to the calls from the client to the server.
|
Note
|
Because of a limitation in Eureka it isn’t possible to support per-server basic auth credentials, so only the first set that are found will be used. |
Status Page and Health Indicator
The status page and health indicators for a Eureka instance default to
"/info" and "/health" respectively, which are the default locations of
useful endpoints in a Spring Boot Actuator application. You need to
change these, even for an Actuator application if you use a
non-default context path or servlet path
(e.g. server.servletPath=/foo) or management endpoint path
(e.g. management.contextPath=/admin). Example:
eureka:
  instance:
    statusPageUrlPath: ${management.context-path}/info
    healthCheckUrlPath: ${management.context-path}/health
These links show up in the metadata that is consumed by clients, and used in some scenarios to decide whether to send requests to your application, so it’s helpful if they are accurate.
Registering a Secure Application
If your app wants to be contacted over HTTPS you can set two flags in
the EurekaInstanceConfig, viz
eureka.instance.[nonSecurePortEnabled,securePortEnabled]=[false,true]
respectively. This will make Eureka publish instance information
showing an explicit preference for secure communication. The Spring
Cloud DiscoveryClient will always return an https://…; URI for a
service configured this way, and the Eureka (native) instance
information will have a secure health check URL.
Because of the way Eureka works internally, it will still publish a non-secure URL for status and home page unless you also override those explicitly. You can use placeholders to configure the eureka instance urls, e.g.
eureka:
  instance:
    statusPageUrl: https://${eureka.hostname}/info
    healthCheckUrl: https://${eureka.hostname}/health
    homePageUrl: https://${eureka.hostname}/
(Note that ${eureka.hostname} is a native placeholder only available
in later versions of Eureka. You could achieve the same thing with
Spring placeholders as well, e.g. using ${eureka.instance.hostName}.)
|
Note
|
If your app is running behind a proxy, and the SSL termination is in the proxy (e.g. if you run in Cloud Foundry or other platforms as a service) then you will need to ensure that the proxy "forwarded" headers are intercepted and handled by the application. An embedded Tomcat container in a Spring Boot app does this automatically if it has explicit configuration for the 'X-Forwarded-\*` headers. A sign that you got this wrong will be that the links rendered by your app to itself will be wrong (the wrong host, port or protocol). |
Eureka’s Health Checks
By default, Eureka uses the client heartbeat to determine if a client is up. Unless specified otherwise the Discovery Client will not propagate the current health check status of the application per the Spring Boot Actuator. Which means that after successful registration Eureka will always announce that the application is in 'UP' state. This behaviour can be altered by enabling Eureka health checks, which results in propagating application status to Eureka. As a consequence every other application won’t be sending traffic to application in state other then 'UP'.
eureka:
  client:
    healthcheck:
      enabled: true
If you require more control over the health checks, you may consider
implementing your own com.netflix.appinfo.HealthCheckHandler.
Eureka Metadata for Instances and Clients
It’s worth spending a bit of time understanding how the Eureka metadata works, so you can use it in a way that makes sense in your platform. There is standard metadata for things like hostname, IP address, port numbers, status page and health check. These are published in the service registry and used by clients to contact the services in a straightforward way. Additional metadata can be added to the instance registration in the eureka.instance.metadataMap, and this will be accessible in the remote clients, but in general will not change the behaviour of the client, unless it is made aware of the meaning of the metadata. There are a couple of special cases described below where Spring Cloud already assigns meaning to the metadata map.
Using Eureka on Cloudfoundry
Cloudfoundry has a global router so that all instances of the same app have the same hostname (it’s the same in other PaaS solutions with a similar architecture). This isn’t necessarily a barrier to using Eureka, but if you use the router (recommended, or even mandatory depending on the way your platform was set up), you need to explicitly set the hostname and port numbers (secure or non-secure) so that they use the router. You might also want to use instance metadata so you can distinguish between the instances on the client (e.g. in a custom load balancer). By default, the eureka.instance.instanceId is vcap.application.instance_id. For example:
eureka:
  instance:
    hostname: ${vcap.application.uris[0]}
    nonSecurePort: 80
Depending on the way the security rules are set up in your Cloudfoundry instance, you might be able to register and use the IP address of the host VM for direct service-to-service calls. This feature is not (yet) available on Pivotal Web Services (PWS).
Using Eureka on AWS
If the application is planned to be deployed to an AWS cloud, then the Eureka instance will have to be configured to be Amazon aware and this can be done by customizing the EurekaInstanceConfigBean the following way:
@Bean
@Profile("!default")
public EurekaInstanceConfigBean eurekaInstanceConfig() {
  EurekaInstanceConfigBean b = new EurekaInstanceConfigBean();
  AmazonInfo info = AmazonInfo.Builder.newBuilder().autoBuild("eureka");
  b.setDataCenterInfo(info);
  return b;
}
Changing the Eureka Instance ID
A vanilla Netflix Eureka instance is registered with an ID that is equal to its host name (i.e. only one service per host). Spring Cloud Eureka provides a sensible default that looks like this: ${spring.cloud.client.hostname}:${spring.application.name}:${spring.application.instance_id:${server.port}}}. For example myhost:myappname:8080.
Using Spring Cloud you can override this by providing a unique identifier in eureka.instance.instanceId. For example:
eureka:
  instance:
    instanceId: ${spring.application.name}:${spring.application.instance_id:${random.value}}
With this metadata, and multiple service instances deployed on
localhost, the random value will kick in there to make the instance
unique. In Cloudfoundry the spring.application.instance_id will be
populated automatically in a Spring Boot Actuator application, so the
random value will not be needed.
Using the EurekaClient
Once you have an app that is @EnableDiscoveryClient (or @EnableEurekaClient) you can use it to
discover service instances from the Eureka Server. One way to do that is to use the native
com.netflix.discovery.EurekaClient (as opposed to the Spring
Cloud DiscoveryClient), e.g.
@Autowired
private EurekaClient discoveryClient;

public String serviceUrl() {
    InstanceInfo instance = discoveryClient.getNextServerFromEureka("STORES", false);
    return instance.getHomePageUrl();
}
|
Tip
|
Don’t use the |
Alternatives to the native Netflix EurekaClient
You don’t have to use the raw Netflix EurekaClient and usually it
is more convenient to use it behind a wrapper of some sort. Spring
Cloud has support for Feign (a REST client
builder) and also Spring RestTemplate using
the logical Eureka service identifiers (VIPs) instead of physical
URLs. To configure Ribbon with a fixed list of physical servers you
can simply set <client>.ribbon.listOfServers to a comma-separated
list of physical addresses (or hostnames), where <client> is the ID
of the client.
You can also use the org.springframework.cloud.client.discovery.DiscoveryClient
which provides a simple API for discovery clients that is not specific
to Netflix, e.g.
@Autowired
private DiscoveryClient discoveryClient;

public String serviceUrl() {
    List<ServiceInstance> list = discoveryClient.getInstances("STORES");
    if (list != null && list.size() > 0 ) {
        return list.get(0).getUri();
    }
    return null;
}
Why is it so Slow to Register a Service?
Being an instance also involves a periodic heartbeat to the registry
(via the client’s serviceUrl) with default duration 30 seconds. A
service is not available for discovery by clients until the instance,
the server and the client all have the same metadata in their local
cache (so it could take 3 heartbeats). You can change the period using
eureka.instance.leaseRenewalIntervalInSeconds and this will speed up
the process of getting clients connected to other services. In
production it’s probably better to stick with the default because
there are some computations internally in the server that make
assumptions about the lease renewal period.
Service Discovery: Eureka Server
Example eureka server (e.g. using spring-cloud-starter-eureka-server to set up the classpath):
@SpringBootApplication
@EnableEurekaServer
public class Application {

    public static void main(String[] args) {
        new SpringApplicationBuilder(Application.class).web(true).run(args);
    }

}
The server has a home page with a UI, and HTTP API endpoints per the
normal Eureka functionality under /eureka/*.
Eureka background reading: see flux capacitor and google group discussion.
|
Tip
|
Due to Gradle’s dependency resolution rules and the lack of a parent bom feature, simply depending on spring-cloud-starter-eureka-server can cause failures on application startup. To remedy this the Spring Boot Gradle plugin must be added and the Spring cloud starter parent bom must be imported like so: build.gradle
|
High Availability, Zones and Regions
The Eureka server does not have a backend store, but the service instances in the registry all have to send heartbeats to keep their registrations up to date (so this can be done in memory). Clients also have an in-memory cache of eureka registrations (so they don’t have to go to the registry for every single request to a service).
By default every Eureka server is also a Eureka client and requires (at least one) service URL to locate a peer. If you don’t provide it the service will run and work, but it will shower your logs with a lot of noise about not being able to register with the peer.
See also below for details of Ribbon support on the client side for Zones and Regions.
Standalone Mode
The combination of the two caches (client and server) and the heartbeats make a standalone Eureka server fairly resilient to failure, as long as there is some sort of monitor or elastic runtime keeping it alive (e.g. Cloud Foundry). In standalone mode, you might prefer to switch off the client side behaviour, so it doesn’t keep trying and failing to reach its peers. Example:
server:
  port: 8761

eureka:
  instance:
    hostname: localhost
  client:
    registerWithEureka: false
    fetchRegistry: false
    serviceUrl:
      defaultZone: http://${eureka.instance.hostname}:${server.port}/eureka/
Notice that the serviceUrl is pointing to the same host as the local
instance.
Peer Awareness
Eureka can be made even more resilient and available by running
multiple instances and asking them to register with each other. In
fact, this is the default behaviour, so all you need to do to make it
work is add a valid serviceUrl to a peer, e.g.
---
spring:
  profiles: peer1
eureka:
  instance:
    hostname: peer1
  client:
    serviceUrl:
      defaultZone: http://peer2/eureka/

---
spring:
  profiles: peer2
eureka:
  instance:
    hostname: peer2
  client:
    serviceUrl:
      defaultZone: http://peer1/eureka/
In this example we have a YAML file that can be used to run the same
server on 2 hosts (peer1 and peer2), by running it in different
Spring profiles. You could use this configuration to test the peer
awareness on a single host (there’s not much value in doing that in
production) by manipulating /etc/hosts to resolve the host names. In
fact, the eureka.instance.hostname is not needed if you are running
on a machine that knows its own hostname (it is looked up using
java.net.InetAddress by default).
You can add multiple peers to a system, and as long as they are all directly connected to each other, they will synchronize the registrations amongst themselves.
eureka:
  client:
    serviceUrl:
      defaultZone: http://peer1/eureka/,http://peer2/eureka/,http://peer3/eureka/

---
spring:
  profiles: peer1
eureka:
  instance:
    hostname: peer1

---
spring:
  profiles: peer2
eureka:
  instance:
    hostname: peer2

---
spring:
  profiles: peer3
eureka:
  instance:
    hostname: peer3
Prefer IP Address
In some cases, it is preferable for Eureka to advertise the IP Adresses
of services rather than the hostname. Set eureka.instance.preferIpAddress
to true and when the application registers with eureka, it will use its
IP Address rather than its hostname.
Circuit Breaker: Hystrix Clients
Netflix has created a library called Hystrix that implements the circuit breaker pattern. In a microservice architecture it is common to have multiple layers of service calls.
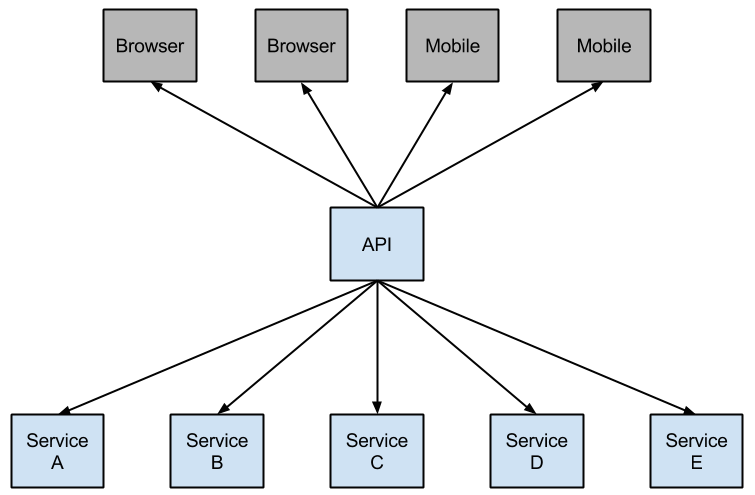
A service failure in the lower level of services can cause cascading failure all the way up to the user. When calls to a particular service reach a certain threshold (20 failures in 5 seconds is the default in Hystrix), the circuit opens and the call is not made. In cases of error and an open circuit a fallback can be provided by the developer.
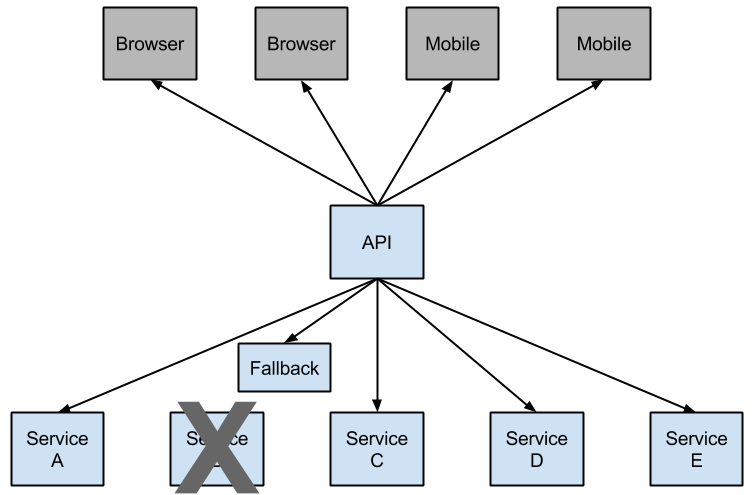
Having an open circuit stops cascading failures and allows overwhelmed or failing services time to heal. The fallback can be another Hystrix protected call, static data or a sane empty value. Fallbacks may be chained so the first fallback makes some other business call which in turn falls back to static data.
Example boot app:
@SpringBootApplication
@EnableCircuitBreaker
public class Application {

    public static void main(String[] args) {
        new SpringApplicationBuilder(Application.class).web(true).run(args);
    }

}

@Component
public class StoreIntegration {

    @HystrixCommand(fallbackMethod = "defaultStores")
    public Object getStores(Map<String, Object> parameters) {
        //do stuff that might fail
    }

    public Object defaultStores(Map<String, Object> parameters) {
        return /* something useful */;
    }
}
The @HystrixCommand is provided by a Netflix contrib library called
"javanica".
Spring Cloud automatically wraps Spring beans with that
annotation in a proxy that is connected to the Hystrix circuit
breaker. The circuit breaker calculates when to open and close the
circuit, and what to do in case of a failure.
To configure the @HystrixCommand you can use the commandProperties
attribute with a list of @HystrixProperty annotations. See
here
for more details. See the Hystrix wiki
for details on the properties available.
Propagating the Security Context or using Spring Scopes
If you want some thread local context to propagate into a @HystrixCommand the default declaration will not work because it executes the command in a thread pool (in case of timeouts). You can switch Hystrix to use the same thread as the caller using some configuration, or directly in the annotation, by asking it to use a different "Isolation Strategy". For example:
@HystrixCommand(fallbackMethod = "stubMyService",
    commandProperties = {
      @HystrixProperty(name="execution.isolation.strategy", value="SEMAPHORE")
    }
)
...
The same thing applies if you are using @SessionScope or @RequestScope. You will know when you need to do this because of a runtime exception that says it can’t find the scoped context.
Health Indicator
The state of the connected circuit breakers are also exposed in the
/health endpoint of the calling application.
{
    "hystrix": {
        "openCircuitBreakers": [
            "StoreIntegration::getStoresByLocationLink"
        ],
        "status": "CIRCUIT_OPEN"
    },
    "status": "UP"
}
Hystrix Metrics Stream
To enable the Hystrix metrics stream include a dependency on spring-boot-starter-actuator. This will expose the /hystrix.stream as a management endpoint.
    <dependency>
        <groupId>org.springframework.boot</groupId>
        <artifactId>spring-boot-starter-actuator</artifactId>
    </dependency>
Circuit Breaker: Hystrix Dashboard
One of the main benefits of Hystrix is the set of metrics it gathers about each HystrixCommand. The Hystrix Dashboard displays the health of each circuit breaker in an efficient manner.
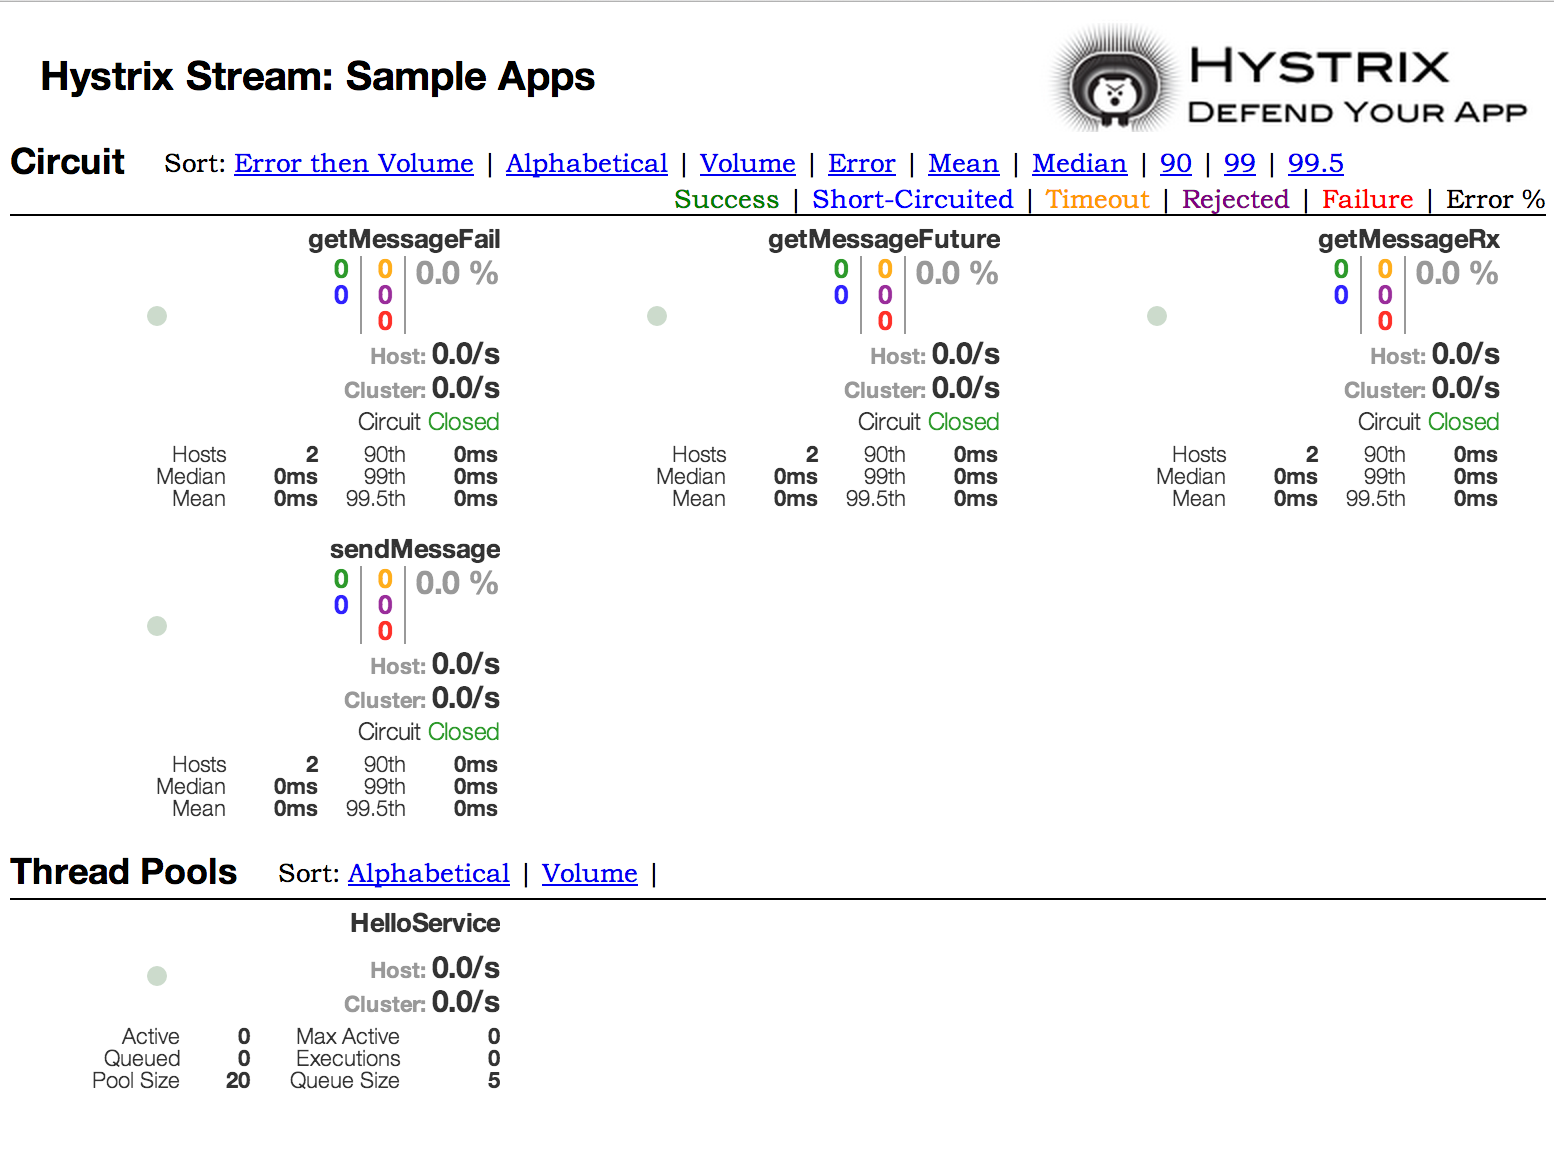
To run the Hystrix Dashboard annotate your Spring Boot main class with @EnableHystrixDashboard. You then visit /hystrix and point the dashboard to an individual instances /hystrix.stream endpoint in a Hystrix client application.
Turbine
Looking at an individual instances Hystrix data is not very useful in terms of the overall health of the system. Turbine is an application that aggregates all of the relevant /hystrix.stream endpoints into a combined /turbine.stream for use in the Hystrix Dashboard. Individual instances are located via Eureka. Running Turbine is as simple as annotating your main class with the @EnableTurbine annotation (e.g. using spring-cloud-starter-turbine to set up the classpath). All of the documented configuration properties from the Turbine 1 wiki apply. The only difference is that the turbine.instanceUrlSuffix does not need the port prepended as this is handled automatically unless turbine.instanceInsertPort=false.
The configuration key turbine.appConfig is a list of eureka serviceIds that turbine will use to lookup instances. The turbine stream is then used in the Hystrix dashboard using a url that looks like: http://my.turbine.sever:8080/turbine.stream?cluster=<CLUSTERNAME>; (the cluster parameter can be omitted if the name is "default"). The cluster parameter must match an entry in turbine.aggregator.clusterConfig. Values returned from eureka are uppercase, thus we expect this example to work if there is an app registered with Eureka called "customers":
turbine:
  aggregator:
    clusterConfig: CUSTOMERS
  appConfig: customers
The clusterName can be customized by a SPEL expression in turbine.clusterNameExpression with root an instance of InstanceInfo. The default value is appName, which means that the Eureka serviceId ends up as the cluster key (i.e. the InstanceInfo for customers has an appName of "CUSTOMERS"). A different example would be turbine.clusterNameExpression=aSGName, which would get the cluster name from the AWS ASG name. Another example:
turbine:
  aggregator:
    clusterConfig: SYSTEM,USER
  appConfig: customers,stores,ui,admin
  clusterNameExpression: metadata['cluster']
In this case, the cluster name from 4 services is pulled from their metadata map, and is expected to have values that include "SYSTEM" and "USER".
To use the "default" cluster for all apps you need a string literal expression (with single quotes, and escaped with double quotes if it is in YAML as well):
turbine:
  appConfig: customers,stores
  clusterNameExpression: "'default'"
Spring Cloud provides a spring-cloud-starter-turbine that has all the dependencies you need to get a Turbine server running. Just create a Spring Boot application and annotate it with @EnableTurbine.
|
Note
|
by default the native Netflix behaviour built into Turbine does not allow multiple processes per host, per cluster (the key to the instance id is the hostname). Spring Cloud generalizes this a bit, allowing the host and port to be used as the key, but only if you set the property turbine.combineHostPort=true
|
Turbine Stream
In some environments (e.g. in a PaaS setting), the classic Turbine model of pulling metrics from all the distributed Hystrix commands doesn’t work. In that case you might want to have your Hystrix commands push metrics to Turbine, and Spring Cloud enables that with messaging. All you need to do on the client is add a dependency to spring-cloud-netflix-hystrix-stream and the spring-cloud-starter-stream-* of your choice (see Spring Cloud Stream documentation for details on the brokers, and how to configure the client credentials, but it should work out of the box for a local broker).
On the server side Just create a Spring Boot application and annotate it with @EnableTurbineStream and by default it will come up on port 8989 (point your Hystrix dashboard to that port, any path). You can customize the port using either server.port or turbine.stream.port. If you have spring-boot-starter-web and spring-boot-starter-actuator on the classpath as well, then you can open up the Actuator endpoints on a separate port (with Tomcat by default) by providing a management.port which is different.
You can then point the Hystrix Dashboard to the Turbine Stream Server instead of individual Hystrix streams. If Turbine Stream is running on port 8989 on myhost, then put http://myhost:8989 in the stream input field in the Hystrix Dashboard. Circuits will be prefixed by their respective serviceId, followed by a dot, then the circuit name.
Spring Cloud provides a spring-cloud-starter-turbine-stream that has all the dependencies you need to get a Turbine Stream server running - just add the Stream binder of your choice, e.g. spring-cloud-starter-stream-rabbit. You need Java 8 to run the app because it is Netty-based.
Client Side Load Balancer: Ribbon
Ribbon is a client side load balancer which gives you a lot of control
over the behaviour of HTTP and TCP clients. Feign already uses Ribbon,
so if you are using @FeignClient then this section also applies.
A central concept in Ribbon is that of the named client. Each load
balancer is part of an ensemble of components that work together to
contact a remote server on demand, and the ensemble has a name that
you give it as an application developer (e.g. using the @FeignClient
annotation). Spring Cloud creates a new ensemble as an
ApplicationContext on demand for each named client using
RibbonClientConfiguration. This contains (amongst other things) an
ILoadBalancer, a RestClient, and a ServerListFilter.
Customizing the Ribbon Client
You can configure some bits of a Ribbon client using external
properties in <client>.ribbon.*, which is no different than using
the Netflix APIs natively, except that you can use Spring Boot
configuration files. The native options can
be inspected as static fields in CommonClientConfigKey (part of
ribbon-core).
Spring Cloud also lets you take full control of the client by
declaring additional configuration (on top of the
RibbonClientConfiguration) using @RibbonClient. Example:
@Configuration
@RibbonClient(name = "foo", configuration = FooConfiguration.class)
public class TestConfiguration {
}
In this case the client is composed from the components already in
RibbonClientConfiguration together with any in FooConfiguration
(where the latter generally will override the former).
|
Warning
|
The FooConfiguration has to be @Configuration but take
care that it is not in a @ComponentScan for the main application
context, otherwise it will be shared by all the @RibbonClients. If
you use @ComponentScan (or @SpringBootApplication) you need to
take steps to avoid it being included (for instance put it in a
separate, non-overlapping package, or specify the packages to scan
explicitly in the @ComponentScan).
|
Spring Cloud Netflix provides the following beans by default for ribbon
(BeanType beanName: ClassName):
-
IClientConfigribbonClientConfig:DefaultClientConfigImpl -
IRuleribbonRule:ZoneAvoidanceRule -
IPingribbonPing:NoOpPing -
ServerList<Server>ribbonServerList:ConfigurationBasedServerList -
ServerListFilter<Server>ribbonServerListFilter:ZonePreferenceServerListFilter -
ILoadBalancerribbonLoadBalancer:ZoneAwareLoadBalancer
Creating a bean of one of those type and placing it in a @RibbonClient
configuration (such as FooConfiguration above) allows you to override each
one of the beans described. Example:
@Configuration
public class FooConfiguration {
    @Bean
    public IPing ribbonPing(IClientConfig config) {
        return new PingUrl();
    }
}
This replaces the NoOpPing with PingUrl.
Using Ribbon with Eureka
When Eureka is used in conjunction with Ribbon the ribbonServerList
is overridden with an extension of DiscoveryEnabledNIWSServerList
which populates the list of servers from Eureka. It also replaces the
IPing interface with NIWSDiscoveryPing which delegates to Eureka
to determine if a server is up. The ServerList that is installed by
default is a DomainExtractingServerList and the purpose of this is
to make physical metadata available to the load balancer without using
AWS AMI metadata (which is what Netflix relies on). By default the
server list will be constructed with "zone" information as provided in
the instance metadata (so on the remote clients set
eureka.instance.metadataMap.zone), and if that is missing it can use
the domain name from the server hostname as a proxy for zone (if the
flag approximateZoneFromHostname is set). Once the zone information
is available it can be used in a ServerListFilter. By default it
will be used to locate a server in the same zone as the client because
the default is a ZonePreferenceServerListFilter. The zone of the
client is determined the same way as the remote instances by default,
i.e. via eureka.instance.metadataMap.zone.
|
Note
|
The orthodox "archaius" way to set the client zone is via a configuration property called "@zone", and Spring Cloud will use that in preference to all other settings if it is available (note that the key will have to be quoted in YAML configuration). |
|
Note
|
If there is no other source of zone data then a guess is made
based on the client configuration (as opposed to the instance
configuration). We take eureka.client.availabilityZones, which is a
map from region name to a list of zones, and pull out the first zone
for the instance’s own region (i.e. the eureka.client.region, which
defaults to "us-east-1" for comatibility with native Netflix).
|
Example: How to Use Ribbon Without Eureka
Eureka is a convenient way to abstract the discovery of remote servers
so you don’t have to hard code their URLs in clients, but if you
prefer not to use it, Ribbon and Feign are still quite
amenable. Suppose you have declared a @RibbonClient for "stores",
and Eureka is not in use (and not even on the classpath). The Ribbon
client defaults to a configured server list, and you can supply the
configuration like this
stores:
  ribbon:
    listOfServers: example.com,google.com
Example: Disable Eureka use in Ribbon
Setting the property ribbon.eureka.enabled = false will explicitly
disable the use of Eureka in Ribbon.
ribbon:
  eureka:
   enabled: false
Using the Ribbon API Directly
You can also use the LoadBalancerClient directly. Example:
public class MyClass {
    @Autowired
    private LoadBalancerClient loadBalancer;

    public void doStuff() {
        ServiceInstance instance = loadBalancer.choose("stores");
        URI storesUri = URI.create(String.format("http://%s:%s", instance.getHost(), instance.getPort()));
        // ... do something with the URI
    }
}
Declarative REST Client: Feign
Feign is a declarative web service client. It makes writing web service clients easier. To use Feign create an interface and annotate it. It has pluggable annotation support including Feign annotations and JAX-RS annotations. Feign also supports pluggable encoders and decoders. Spring Cloud adds support for Spring MVC annotations and for using the same HttpMessageConverters used by default in Spring Web. Spring Cloud integrates Ribbon and Eureka to provide a load balanced http client when using Feign.
Example spring boot app
@Configuration
@ComponentScan
@EnableAutoConfiguration
@EnableEurekaClient
@EnableFeignClients
public class Application {

    public static void main(String[] args) {
        SpringApplication.run(Application.class, args);
    }

}@FeignClient("stores")
public interface StoreClient {
@RequestMapping(method = RequestMethod.GET, value = "/stores")
List<Store> getStores();
@RequestMapping(method = RequestMethod.POST, value = "/stores/{storeId}", consumes = "application/json")
Store update(@PathVariable("storeId") Long storeId, Store store);
}In the @FeignClient annotation the String value ("stores" above) is
an arbitrary client name, which is used to create a Ribbon load
balancer (see below for details of Ribbon
support). You can also specify a URL using the url attribute
(absolute value or just a hostname). The name of the bean in the application context is the fully qualified name of the interface. An alias is also created which is the 'name' attribute plus 'FeignClient'. For the example above, @Qualifier("storesFeignClient") could be used to reference the bean.
The Ribbon client above will want to discover the physical addresses for the "stores" service. If your application is a Eureka client then it will resolve the service in the Eureka service registry. If you don’t want to use Eureka, you can simply configure a list of servers in your external configuration (see above for example).
Overriding Feign Defaults
A central concept in Spring Cloud’s Feign support is that of the named client. Each feign client is part of an ensemble of components that work together to contact a remote server on demand, and the ensemble has a name that you give it as an application developer using the @FeignClient annotation. Spring Cloud creates a new ensemble as an
ApplicationContext on demand for each named client using FeignClientsConfiguration. This contains (amongst other things) an feign.Decoder, a feign.Encoder, and a feign.Contract.
Spring Cloud lets you take full control of the feign client by declaring additional configuration (on top of the FeignClientsConfiguration) using @FeignClient. Example:
@FeignClient(name = "stores", configuration = FooConfiguration.class)
public interface StoreClient {
    //..
}
In this case the client is composed from the components already in FeignClientsConfiguration together with any in FooConfiguration (where the latter will override the former).
|
Warning
|
The FooConfiguration has to be @Configuration but take care that it is not in a @ComponentScan for the main application context, otherwise it will be used for every @FeignClient. If you use @ComponentScan (or @SpringBootApplication) you need to take steps to avoid it being included (for instance put it in a separate, non-overlapping package, or specify the packages to scan explicitly in the @ComponentScan).
|
|
Note
|
The serviceId attribute is now deprecated in favor of the name attribute.
|
|
Warning
|
Previously, using the url attribute, did not require the name attribute. Using name is now required.
|
Placeholders are supported in the name and url attributes.
@FeignClient(name = "${feign.name}", url = "${feign.url}")
public interface StoreClient {
    //..
}
Spring Cloud Netflix provides the following beans by default for feign (BeanType beanName: ClassName):
-
DecoderfeignDecoder:ResponseEntityDecoder(which wraps aSpringDecoder) -
EncoderfeignEncoder:SpringEncoder -
LoggerfeignLogger:Slf4jLogger -
ContractfeignContract:SpringMvcContract -
Feign.BuilderfeignBuilder:HystrixFeign.Builder
Spring Cloud Netflix does not provide the following beans by default for feign, but still looks up beans of these types from the application context to create the feign client:
-
Logger.Level -
Retryer -
ErrorDecoder -
Request.Options -
Collection<RequestInterceptor>
Creating a bean of one of those type and placing it in a @FeignClient configuration (such as FooConfiguration above) allows you to override each one of the beans described. Example:
@Configuration
public class FooConfiguration {
    @Bean
    public Contract feignContract() {
        return new feign.Contract.Default();
    }

    @Bean
    public BasicAuthRequestInterceptor basicAuthRequestInterceptor() {
        return new BasicAuthRequestInterceptor("user", "password");
    }
}
This replaces the SpringMvcContract with feign.Contract.Default and adds a RequestInterceptor to the collection of RequestInterceptor.
Default configurations can be specified in the @EnableFeignClients attribute defaultConfiguration in a similar manner as described above. The difference is that this configuration will apply to all feign clients.
Feign Hystrix Support
If Hystrix is on the classpath, by default Feign will wrap all methods with a circuit breaker. Returning a com.netflix.hystrix.HystrixCommand is also available. This lets you use reactive patterns (with a call to .toObservable() or .observe() or asynchronous use (with a call to .queue()).
To disable Hystrix support for Feign, set feign.hystrix.enabled=false.
To disable Hystrix support on a per-client basis create a vanilla Feign.Builder with the "prototype" scope, e.g.:
@Configuration
public class FooConfiguration {
    @Bean
	@Scope("prototype")
	public Feign.Builder feignBuilder() {
		return Feign.builder();
	}
}
Feign Hystrix Fallbacks
Hystrix supports the notion of a fallback: a default code path that is executed when they circuit is open or there is an error. To enable fallbacks for a given @FeignClient set the fallback attribute to the class name that implements the fallback.
@FeignClient(name = "hello", fallback = HystrixClientFallback.class)
protected interface HystrixClient {
    @RequestMapping(method = RequestMethod.GET, value = "/hello")
    Hello iFailSometimes();
}

static class HystrixClientFallback implements HystrixClient {
    @Override
    public Hello iFailSometimes() {
        return new Hello("fallback");
    }
}|
Warning
|
There is a limitation with the implementation of fallbacks in Feign and how Hystrix fallbacks work. Fallbacks are currently not supported for methods that return com.netflix.hystrix.HystrixCommand and rx.Observable.
|
Feign Inheritance Support
Feign supports boilerplate apis via single-inheritance interfaces. This allows grouping common operations into convenient base interfaces.
public interface UserService {

    @RequestMapping(method = RequestMethod.GET, value ="/users/{id}")
    User getUser(@PathVariable("id") long id);
}@RestController
public class UserResource implements UserService {
}package project.user;
@FeignClient("users")
public interface UserClient extends UserService {
}|
Note
|
It is generally not advisable to share an interface between a server and a client. It introduces tight coupling, and also actually doesn’t work with Spring MVC in its current form (method parameter mapping is not inherited). |
Feign request/response compression
You may consider enabling the request or response GZIP compression for your Feign requests. You can do this by enabling one of the properties:
feign.compression.request.enabled=true
feign.compression.response.enabled=true
Feign request compression gives you settings similar to what you may set for your web server:
feign.compression.request.enabled=true
feign.compression.request.mime-types=text/xml,application/xml,application/json
feign.compression.request.min-request-size=2048
These properties allow you to be selective about the compressed media types and minimum request threshold length.
Feign logging
A logger is created for each Feign client created. By default the name of the logger is the full class name of the interface used to create the Feign client. Feign logging only responds to the DEBUG level.
logging.level.project.user.UserClient: DEBUGThe Logger.Level object that you may configure per client, tells Feign how much to log. Choices are:
-
NONE, No logging (DEFAULT). -
BASIC, Log only the request method and URL and the response status code and execution time. -
HEADERS, Log the basic information along with request and response headers. -
FULL, Log the headers, body, and metadata for both requests and responses.
For example, the following would set the Logger.Level to FULL:
@Configuration
public class FooConfiguration {
    @Bean
    Logger.Level feignLoggerLevel() {
        return Logger.Level.FULL;
    }
}
External Configuration: Archaius
Archaius is the Netflix client side configuration library. It is the library used by all of the Netflix OSS components for configuration. Archaius is an extension of the Apache Commons Configuration project. It allows updates to configuration by either polling a source for changes or for a source to push changes to the client. Archaius uses Dynamic<Type>Property classes as handles to properties.
class ArchaiusTest {
    DynamicStringProperty myprop = DynamicPropertyFactory
            .getInstance()
            .getStringProperty("my.prop");

    void doSomething() {
        OtherClass.someMethod(myprop.get());
    }
}
Archaius has its own set of configuration files and loading priorities. Spring applications should generally not use Archaius directly, but the need to configure the Netflix tools natively remains. Spring Cloud has a Spring Environment Bridge so Archaius can read properties from the Spring Environment. This allows Spring Boot projects to use the normal configuration toolchain, while allowing them to configure the Netflix tools, for the most part, as documented.
Router and Filter: Zuul
Routing in an integral part of a microservice architecture. For example, / may be mapped to your web application, /api/users is mapped to the user service and /api/shop is mapped to the shop service. Zuul is a JVM based router and server side load balancer by Netflix.
Netflix uses Zuul for the following:
-
Authentication
-
Insights
-
Stress Testing
-
Canary Testing
-
Dynamic Routing
-
Service Migration
-
Load Shedding
-
Security
-
Static Response handling
-
Active/Active traffic management
Zuul’s rule engine allows rules and filters to be written in essentially any JVM language, with built in support for Java and Groovy.
|
Note
|
The configuration property zuul.max.host.connections has been replaced by two new properties, zuul.host.maxTotalConnections and zuul.host.maxPerRouteConnections which default to 200 and 20 respectively.
|
Embedded Zuul Reverse Proxy
Spring Cloud has created an embedded Zuul proxy to ease the development of a very common use case where a UI application wants to proxy calls to one or more back end services. This feature is useful for a user interface to proxy to the backend services it requires, avoiding the need to manage CORS and authentication concerns independently for all the backends.
To enable it, annotate a Spring Boot main class with
@EnableZuulProxy, and this forwards local calls to the appropriate
service. By convention, a service with the ID "users", will
receive requests from the proxy located at /users (with the prefix
stripped). The proxy uses Ribbon to locate an instance to forward to
via discovery, and all requests are executed in a hystrix command, so
failures will show up in Hystrix metrics, and once the circuit is open
the proxy will not try to contact the service.
|
Note
|
the Zuul starter does not include a discovery client, so for routes based on service IDs you need to provide one of those on the classpath as well (e.g. Eureka is one choice). |
To skip having a service automatically added, set
zuul.ignored-services to a list of service id patterns. If a service
matches a pattern that is ignored, but also included in the explicitly
configured routes map, then it will be unignored. Example:
 zuul:
  ignoredServices: '*'
  routes:
    users: /myusers/**
In this example, all services are ignored except "users".
To augment or change the proxy routes, you can add external configuration like the following:
 zuul:
  routes:
    users: /myusers/**
This means that http calls to "/myusers" get forwarded to the "users" service (for example "/myusers/101" is forwarded to "/101").
To get more fine-grained control over a route you can specify the path and the serviceId independently:
 zuul:
  routes:
    users:
      path: /myusers/**
      serviceId: users_service
This means that http calls to "/myusers" get forwarded to the "users_service" service. The route has to have a "path" which can be specified as an ant-style pattern, so "/myusers/*" only matches one level, but "/myusers/**" matches hierarchically.
The location of the backend can be specified as either a "serviceId" (for a service from discovery) or a "url" (for a physical location), e.g.
 zuul:
  routes:
    users:
      path: /myusers/**
      url: http://example.com/users_service
These simple url-routes don’t get executed as a HystrixCommand nor can you loadbalance multiple URLs with Ribbon.
To achieve this, specify a service-route and configure a Ribbon client for the
serviceId (this currently requires disabling Eureka support in Ribbon:
see above for more information), e.g.
zuul:
  routes:
    users:
      path: /myusers/**
      serviceId: users

ribbon:
  eureka:
    enabled: false

users:
  ribbon:
    listOfServers: example.com,google.com
You can provide convention between serviceId and routes using regexmapper. It uses regular expression named groups to extract variables from serviceId and inject them into a route pattern.
@Bean
public PatternServiceRouteMapper serviceRouteMapper() {
    return new PatternServiceRouteMapper(
        "(?<name>^.+)-(?<version>v.+$)",
        "${version}/${name}");
}
This means that a serviceId "myusers-v1" will be mapped to route "/v1/myusers/**". Any regular expression is accepted but all named groups must be present in both servicePattern and routePattern. If servicePattern does not match a serviceId, the default behavior is used. In the example above, a serviceId "myusers" will be mapped to route "/myusers/**" (no version detected) This feature is disable by default and only applies to discovered services.
To add a prefix to all mappings, set zuul.prefix to a value, such as
/api. The proxy prefix is stripped from the request before the
request is forwarded by default (switch this behaviour off with
zuul.stripPrefix=false). You can also switch off the stripping of
the service-specific prefix from individual routes, e.g.
 zuul:
  routes:
    users:
      path: /myusers/**
      stripPrefix: false
In this example, requests to "/myusers/101" will be forwarded to "/myusers/101" on the "users" service.
The zuul.routes entries actually bind to an object of type ZuulProperties. If you
look at the properties of that object you will see that it also has a "retryable" flag.
Set that flag to "true" to have the Ribbon client automatically retry failed requests
(and if you need to you can modify the parameters of the retry operations using
the Ribbon client configuration).
The X-Forwarded-Host header is added to the forwarded requests by
default. To turn it off set zuul.addProxyHeaders = false. The
prefix path is stripped by default, and the request to the backend
picks up a header "X-Forwarded-Prefix" ("/myusers" in the examples
above).
An application with @EnableZuulProxy could act as a standalone
server if you set a default route ("/"), for example zuul.route.home:
/ would route all traffic (i.e. "/**") to the "home" service.
If more fine-grained ignoring is needed, you can specify specific patterns to ignore. These patterns are evaluated at the start of the route location process, which means prefixes should be included in the pattern to warrant a match. Ignored patterns span all services and supersede any other route specification.
 zuul:
  ignoredPatterns: /**/admin/**
  routes:
    users: /myusers/**
This means that all calls such as "/myusers/101" will be forwarded to "/101" on the "users" service. But calls including "/admin/" will not resolve.
Cookies and Sensitive Headers
It’s OK to share headers between services in the same system, but you probably don’t want sensitive headers leaking downstream into external servers. You can specify a list of ignored headers as part of the route configuration. Cookies play a special role because they have well-defined semantics in browsers, and they are always to be treated as sensitive. If the consumer of your proxy is a browser, then cookies for downstream services also cause problems for the user because they all get jumbled up (all downstream services look like they come from the same place).
If you are careful with the design of your services, for example if only one of the downstream services sets cookies, then you might be able to let them flow from the backend all the way up to the caller. Also, if your proxy sets cookies and all your back end services are part of the same system, it can be natural to simply share them (and for instance use Spring Session to link them up to some shared state). Other than that, any cookies that get set by downstream services are likely to be not very useful to the caller, so it is recommended that you make (at least) "Set-Cookie" and "Cookie" into sensitive headers for routes that are not part of your domain. Even for routes that are part of your domain, try to think carefully about what it means before allowing cookies to flow between them and the proxy.
The sensitive headers can be configured as a comma-separated list per route, e.g.
 zuul:
  routes:
    users:
      path: /myusers/**
      sensitiveHeaders: Cookie,Set-Cookie,Authorization
      url: https://downstream
Sensitive headers can also be set globally by setting zuul.sensitiveHeaders. If sensitiveHeaders is set on a route, this will override the global sensitiveHeaders setting.
|
Note
|
this is the default value for sensitiveHeaders, so you don’t
need to set it unless you want it to be different. N.B. this is new in
Spring Cloud Netflix 1.1 (in 1.0 the user had no control over headers
and all cookies flow in both directions).
|
In addition to the per-route sensitive headers, you can set a global
value for zuul.ignoredHeaders for values that should be discarded
(both request and response) during interactions with downstream
services. By default these are empty, if Spring Security is not on the
classpath, and otherwise they are initialized to a set of well-known
"security" headers (e.g. involving caching) as specified by Spring
Security. The assumption in this case is that the downstream services
might add these headers too, and we want the values from the proxy.
The Routes Endpoint
If you are using @EnableZuulProxy with tha Spring Boot Actuator you
will enable (by default) an additional endpoint, available via HTTP as
/routes. A GET to this endpoint will return a list of the mapped
routes. A POST will force a refresh of the existing routes (e.g. in
case there have been changes in the service catalog).
|
Note
|
the routes should respond automatically to changes in the service catalog, but the POST to /routes is a way to force the change to happen immediately. |
Strangulation Patterns and Local Forwards
A common pattern when migrating an existing application or API is to "strangle" old endpoints, slowly replacing them with different implementations. The Zuul proxy is a useful tool for this because you can use it to handle all traffic from clients of the old endpoints, but redirect some of the requests to new ones.
Example configuration:
 zuul:
  routes:
    first:
      path: /first/**
      url: http://first.example.com
    second:
      path: /second/**
      url: forward:/second
    third:
      path: /third/**
      url: forward:/3rd
    legacy:
      path: /**
      url: http://legacy.example.com
In this example we are strangling the "legacy" app which is mapped to
all requests that do not match one of the other patterns. Paths in
/first/** have been extracted into a new service with an external
URL. And paths in /second/** are forwared so they can be handled
locally, e.g. with a normal Spring @RequestMapping. Paths in
/third/** are also forwarded, but with a different prefix
(i.e. /third/foo is forwarded to /3rd/foo).
|
Note
|
The ignored patterns aren’t completely ignored, they just aren’t handled by the proxy (so they are also effectively forwarded locally). |
Uploading Files through Zuul
If you @EnableZuulProxy you can use the proxy paths to
upload files and it should just work as long as the files
are small. For large files there is an alternative path
which bypasses the Spring DispatcherServlet (to
avoid multipart processing) in "/zuul/*". I.e. if
zuul.routes.customers=/customers/** then you can
POST large files to "/zuul/customers/*". The servlet
path is externalized via zuul.servletPath. Extremely
large files will also require elevated timeout settings
if the proxy route takes you through a Ribbon load
balancer, e.g.
hystrix.command.default.execution.isolation.thread.timeoutInMilliseconds: 60000
ribbon:
  ConnectTimeout: 3000
  ReadTimeout: 60000
Note that for streaming to work with large files, you need to use chunked encoding in the request (which some browsers do not do by default). E.g. on the command line:
$ curl -v -H "Transfer-Encoding: chunked" \
    -F "[email protected]" localhost:9999/zuul/simple/file
Plain Embedded Zuul
You can also run a Zuul server without the proxying, or switch on parts of the proxying platform selectively, if you
use @EnableZuulServer (instead of @EnableZuulProxy). Any beans that you add to the application of type ZuulFilter
will be installed automatically, as they are with @EnableZuulProxy, but without any of the proxy filters being added
automatically.
In this case the routes into the Zuul server are still specified by configuring "zuul.routes.*", but there is no service discovery and no proxying, so the "serviceId" and "url" settings are ignored. For example:
 zuul:
  routes:
    api: /api/**
maps all paths in "/api/**" to the Zuul filter chain.
Disable Zuul Filters
Zuul for Spring Cloud comes with a number of ZuulFilter beans enabled by default
in both proxy and server mode. See the zuul filters package for the
possible filters that are enabled. If you want to disable one, simply set
zuul.<SimpleClassName>.<filterType>.disable=true. By convention, the package after
filters is the Zuul filter type. For example to disable
org.springframework.cloud.netflix.zuul.filters.post.SendResponseFilter set
zuul.SendResponseFilter.post.disable=true.
Polyglot support with Sidecar
Do you have non-jvm languages you want to take advantage of Eureka, Ribbon and Config Server? The Spring Cloud Netflix Sidecar was inspired by Netflix Prana. It includes a simple http api to get all of the instances (ie host and port) for a given service. You can also proxy service calls through an embedded Zuul proxy which gets its route entries from Eureka. The Spring Cloud Config Server can be accessed directly via host lookup or through the Zuul Proxy. The non-jvm app should implement a health check so the Sidecar can report to eureka if the app is up or down.
To enable the Sidecar, create a Spring Boot application with @EnableSidecar.
This annotation includes @EnableCircuitBreaker, @EnableDiscoveryClient,
and @EnableZuulProxy. Run the resulting application on the same host as the
non-jvm application.
To configure the side car add sidecar.port and sidecar.health-uri to application.yml.
The sidecar.port property is the port the non-jvm app is listening on. This
is so the Sidecar can properly register the app with Eureka. The sidecar.health-uri
is a uri accessible on the non-jvm app that mimicks a Spring Boot health
indicator. It should return a json document like the following:
{
  "status":"UP"
}
Here is an example application.yml for a Sidecar application:
server:
  port: 5678
spring:
  application:
    name: sidecar

sidecar:
  port: 8000
  health-uri: http://localhost:8000/health.json
The api for the DiscoveryClient.getInstances() method is /hosts/{serviceId}.
Here is an example response for /hosts/customers that returns two instances on
different hosts. This api is accessible to the non-jvm app (if the sidecar is
on port 5678) at http://localhost:5678/hosts/{serviceId}.
[
    {
        "host": "myhost",
        "port": 9000,
        "uri": "http://myhost:9000",
        "serviceId": "CUSTOMERS",
        "secure": false
    },
    {
        "host": "myhost2",
        "port": 9000,
        "uri": "http://myhost2:9000",
        "serviceId": "CUSTOMERS",
        "secure": false
    }
]
The Zuul proxy automatically adds routes for each service known in eureka to
/<serviceId>, so the customers service is available at /customers. The
Non-jvm app can access the customer service via http://localhost:5678/customers
(assuming the sidecar is listening on port 5678).
If the Config Server is registered with Eureka, non-jvm application can access
it via the Zuul proxy. If the serviceId of the ConfigServer is configserver
and the Sidecar is on port 5678, then it can be accessed at
http://localhost:5678/configserver
Non-jvm app can take advantage of the Config Server’s ability to return YAML documents. For example, a call to http://sidecar.local.spring.io:5678/configserver/default-master.yml might result in a YAML document like the following
eureka:
  client:
    serviceUrl:
      defaultZone: http://localhost:8761/eureka/
  password: password
info:
  description: Spring Cloud Samples
  url: https://github.com/spring-cloud-samples
RxJava with Spring MVC
Spring Cloud Netflix includes the RxJava.
RxJava is a Java VM implementation of Reactive Extensions: a library for composing asynchronous and event-based programs by using observable sequences.
Spring Cloud Netflix provides support for returning rx.Single objects from Spring MVC Controllers. It also supports using rx.Observable objects for Server-sent events (SSE). This can be very convenient if your internal APIs are already built using RxJava (see Feign Hystrix Support for examples).
Here are some examples of using rx.Single:
      @RequestMapping(method = RequestMethod.GET, value = "/single")
      public Single<String> single() {
          return Single.just("single value");
      }

@RequestMapping(method = RequestMethod.GET, value = "/singleWithResponse")
public ResponseEntity<Single<String>> singleWithResponse() {
	return new ResponseEntity<>(Single.just("single value"),
			HttpStatus.NOT_FOUND);
}

@RequestMapping(method = RequestMethod.GET, value = "/singleCreatedWithResponse")
public Single<ResponseEntity<String>> singleOuterWithResponse() {
	return Single.just(new ResponseEntity<>("single value", HttpStatus.CREATED));
}

      @RequestMapping(method = RequestMethod.GET, value = "/throw")
      public Single<Object> error() {
          return Single.error(new RuntimeException("Unexpected"));
      }
If you have an Observable, rather than a single, you can use .toSingle() or .toList().toSingle(). Here are some examples:
@RequestMapping(method = RequestMethod.GET, value = "/single")
public Single<String> single() {
    return Observable.just("single value").toSingle();
}

@RequestMapping(method = RequestMethod.GET, value = "/multiple")
public Single<List<String>> multiple() {
    return Observable.just("multiple", "values").toList().toSingle();
}

@RequestMapping(method = RequestMethod.GET, value = "/responseWithObservable")
public ResponseEntity<Single<String>> responseWithObservable() {

    Observable<String> observable = Observable.just("single value");
    HttpHeaders headers = new HttpHeaders();
    headers.setContentType(APPLICATION_JSON_UTF8);
    return new ResponseEntity<>(observable.toSingle(), headers, HttpStatus.CREATED);
}

@RequestMapping(method = RequestMethod.GET, value = "/timeout")
public Observable<String> timeout() {
    return Observable.timer(1, TimeUnit.MINUTES).map(new Func1<Long, String>() {
        @Override
        public String call(Long aLong) {
            return "single value";
        }
    });
}
If you have a streaming endpoint and client, SSE could be an option. To convert rx.Observable to a Spring SseEmitter use RxResponse.sse(). Here are some examples:
@RequestMapping(method = RequestMethod.GET, value = "/sse")
public SseEmitter single() {
    return RxResponse.sse(Observable.just("single value"));
}

@RequestMapping(method = RequestMethod.GET, value = "/messages")
public SseEmitter messages() {
    return RxResponse.sse(Observable.just("message 1", "message 2", "message 3"));
}

@RequestMapping(method = RequestMethod.GET, value = "/events")
public SseEmitter event() {
    return RxResponse.sse(APPLICATION_JSON_UTF8, Observable.just(
            new EventDto("Spring io", getDate(2016, 5, 19)),
            new EventDto("SpringOnePlatform", getDate(2016, 8, 1))
    ));
}
Metrics: Spectator, Servo, and Atlas
When used together, Spectator/Servo and Atlas provide a near real-time operational insight platform.
Spectator and Servo are Netflix’s metrics collection libraries. Atlas is a Netflix metrics backend to manage dimensional time series data.
Servo served Netflix for several years and is still usable, but is gradually being phased out in favor of Spectator, which is only designed to work with Java 8. Spring Cloud Netflix provides support for both, but Java 8 based applications are encouraged to use Spectator.
Dimensional vs. Hierarchical Metrics
Spring Boot Actuator metrics are hierarchical and metrics are separated only by name. These names often follow a naming convention that embeds key/value attribute pairs (dimensions) into the name separated by periods. Consider the following metrics for two endpoints, root and star-star:
{
    "counter.status.200.root": 20,
    "counter.status.400.root": 3,
    "counter.status.200.star-star": 5,
}
The first metric gives us a normalized count of successful requests against the root endpoint per unit of time. But what if the system had 20 endpoints and you want to get a count of successful requests against all the endpoints? Some hierarchical metrics backends would allow you to specify a wild card such as counter.status.200. that would read all 20 metrics and aggregate the results. Alternatively, you could provide a HandlerInterceptorAdapter that intercepts and records a metric like counter.status.200.all for all successful requests irrespective of the endpoint, but now you must write 20+1 different metrics. Similarly if you want to know the total number of successful requests for all endpoints in the service, you could specify a wild card such as counter.status.2.*.
Even in the presence of wildcarding support on a hierarchical metrics backend, naming consistency can be difficult. Specifically the position of these tags in the name string can slip with time, breaking queries. For example, suppose we add an additional dimension to the hierarchical metrics above for HTTP method. Then counter.status.200.root becomes counter.status.200.method.get.root, etc. Our counter.status.200.* suddenly no longer has the same semantic meaning. Furthermore, if the new dimension is not applied uniformly across the codebase, certain queries may become impossible. This can quickly get out of hand.
Netflix metrics are tagged (a.k.a. dimensional). Each metric has a name, but this single named metric can contain multiple statistics and 'tag' key/value pairs that allows more querying flexibility. In fact, the statistics themselves are recorded in a special tag.
Recorded with Netflix Servo or Spectator, a timer for the root endpoint described above contains 4 statistics per status code, where the count statistic is identical to Spring Boot Actuator’s counter. In the event that we have encountered an HTTP 200 and 400 thus far, there will be 8 available data points:
{
    "root(status=200,stastic=count)": 20,
    "root(status=200,stastic=max)": 0.7265630630000001,
    "root(status=200,stastic=totalOfSquares)": 0.04759702862580789,
    "root(status=200,stastic=totalTime)": 0.2093076914666667,
    "root(status=400,stastic=count)": 1,
    "root(status=400,stastic=max)": 0,
    "root(status=400,stastic=totalOfSquares)": 0,
    "root(status=400,stastic=totalTime)": 0,
}
Default Metrics Collection
Without any additional dependencies or configuration, a Spring Cloud based service will autoconfigure a Servo MonitorRegistry and begin collecting metrics on every Spring MVC request. By default, a Servo timer with the name rest will be recorded for each MVC request which is tagged with:
-
HTTP method
-
HTTP status (e.g. 200, 400, 500)
-
URI (or "root" if the URI is empty), sanitized for Atlas
-
The exception class name, if the request handler threw an exception
-
The caller, if a request header with a key matching
netflix.metrics.rest.callerHeaderis set on the request. There is no default key fornetflix.metrics.rest.callerHeader. You must add it to your application properties if you wish to collect caller information.
Set the netflix.metrics.rest.metricName property to change the name of the metric from rest to a name you provide.
If Spring AOP is enabled and org.aspectj:aspectjweaver is present on your runtime classpath, Spring Cloud will also collect metrics on every client call made with RestTemplate. A Servo timer with the name of restclient will be recorded for each MVC request which is tagged with:
-
HTTP method
-
HTTP status (e.g. 200, 400, 500), "CLIENT_ERROR" if the response returned null, or "IO_ERROR" if an
IOExceptionoccurred during the execution of theRestTemplatemethod -
URI, sanitized for Atlas
-
Client name
Metrics Collection: Spectator
To enable Spectator metrics, include a dependency on spring-boot-starter-spectator:
    <dependency>
        <groupId>org.springframework.cloud</groupId>
        <artifactId>spring-cloud-starter-spectator</artifactId>
    </dependency>
In Spectator parlance, a meter is a named, typed, and tagged configuration and a metric represents the value of a given meter at a point in time. Spectator meters are created and controlled by a registry, which currently has several different implementations. Spectator provides 4 meter types: counter, timer, gauge, and distribution summary.
Spring Cloud Spectator integration configures an injectable com.netflix.spectator.api.Registry instance for you. Specifically, it configures a ServoRegistry instance in order to unify the collection of REST metrics and the exporting of metrics to the Atlas backend under a single Servo API. Practically, this means that your code may use a mixture of Servo monitors and Spectator meters and both will be scooped up by Spring Boot Actuator MetricReader instances and both will be shipped to the Atlas backend.
Spectator Counter
A counter is used to measure the rate at which some event is occurring.
// create a counter with a name and a set of tags
Counter counter = registry.counter("counterName", "tagKey1", "tagValue1", ...);
counter.increment(); // increment when an event occurs
counter.increment(10); // increment by a discrete amount
The counter records a single time-normalized statistic.
Spectator Timer
A timer is used to measure how long some event is taking. Spring Cloud automatically records timers for Spring MVC requests and conditionally RestTemplate requests, which can later be used to create dashboards for request related metrics like latency:
image::RequestLatency.png []
// create a timer with a name and a set of tags
Timer timer = registry.timer("timerName", "tagKey1", "tagValue1", ...);

// execute an operation and time it at the same time
T result = timer.record(() -> fooReturnsT());

// alternatively, if you must manually record the time
Long start = System.nanoTime();
T result = fooReturnsT();
timer.record(System.nanoTime() - start, TimeUnit.NANOSECONDS);
The timer simultaneously records 4 statistics: count, max, totalOfSquares, and totalTime. The count statistic will always match the single normalized value provided by a counter if you had called increment() once on the counter for each time you recorded a timing, so it is rarely necessary to count and time separately for a single operation.
For long running operations, Spectator provides a special LongTaskTimer.
Spectator Gauge
Gauges are used to determine some current value like the size of a queue or number of threads in a running state. Since gauges are sampled, they provide no information about how these values fluctuate between samples.
The normal use of a gauge involves registering the gauge once in initialization with an id, a reference to the object to be sampled, and a function to get or compute a numeric value based on the object. The reference to the object is passed in separately and the Spectator registry will keep a weak reference to the object. If the object is garbage collected, then Spectator will automatically drop the registration. See the note in Spectator’s documentation about potential memory leaks if this API is misused.
// the registry will automatically sample this gauge periodically
registry.gauge("gaugeName", pool, Pool::numberOfRunningThreads);

// manually sample a value in code at periodic intervals -- last resort!
registry.gauge("gaugeName", Arrays.asList("tagKey1", "tagValue1", ...), 1000);
Spectator Distribution Summaries
A distribution summary is used to track the distribution of events. It is similar to a timer, but more general in that the size does not have to be a period of time. For example, a distribution summary could be used to measure the payload sizes of requests hitting a server.
// the registry will automatically sample this gauge periodically
DistributionSummary ds = registry.distributionSummary("dsName", "tagKey1", "tagValue1", ...);
ds.record(request.sizeInBytes());
Metrics Collection: Servo
|
Warning
|
If your code is compiled on Java 8, please use Spectator instead of Servo as Spectator is destined to replace Servo entirely in the long term. |
In Servo parlance, a monitor is a named, typed, and tagged configuration and a metric represents the value of a given monitor at a point in time. Servo monitors are logically equivalent to Spectator meters. Servo monitors are created and controlled by a MonitorRegistry. In spite of the above warning, Servo does have a wider array of monitor options than Spectator has meters.
Spring Cloud integration configures an injectable com.netflix.servo.MonitorRegistry instance for you. Once you have created the appropriate Monitor type in Servo, the process of recording data is wholly similar to Spectator.
Creating Servo Monitors
If you are using the Servo MonitorRegistry instance provided by Spring Cloud (specifically, an instance of DefaultMonitorRegistry), Servo provides convenience classes for retrieving counters and timers. These convenience classes ensure that only one Monitor is registered for each unique combination of name and tags.
To manually create a Monitor type in Servo, especially for the more exotic monitor types for which convenience methods are not provided, instantiate the appropriate type by providing a MonitorConfig instance:
MonitorConfig config = MonitorConfig.builder("timerName").withTag("tagKey1", "tagValue1").build();

// somewhere we should cache this Monitor by MonitorConfig
Timer timer = new BasicTimer(config);
monitorRegistry.register(timer);
Metrics Backend: Atlas
Atlas was developed by Netflix to manage dimensional time series data for near real-time operational insight. Atlas features in-memory data storage, allowing it to gather and report very large numbers of metrics, very quickly.
Atlas captures operational intelligence. Whereas business intelligence is data gathered for analyzing trends over time, operational intelligence provides a picture of what is currently happening within a system.
Spring Cloud provides a spring-cloud-starter-atlas that has all the dependencies you need. Then just annotate your Spring Boot application with @EnableAtlas and provide a location for your running Atlas server with the netflix.atlas.uri property.
Global tags
Spring Cloud enables you to add tags to every metric sent to the Atlas backend. Global tags can be used to separate metrics by application name, environment, region, etc.
Each bean implementing AtlasTagProvider will contribute to the global tag list:
@Bean
AtlasTagProvider atlasCommonTags(
    @Value("${spring.application.name}") String appName) {
  return () -> Collections.singletonMap("app", appName);
}
Using Atlas
To bootstrap a in-memory standalone Atlas instance:
$ curl -LO https://github.com/Netflix/atlas/releases/download/v1.4.2/atlas-1.4.2-standalone.jar
$ java -jar atlas-1.4.2-standalone.jar|
Tip
|
An Atlas standalone node running on an r3.2xlarge (61GB RAM) can handle roughly 2 million metrics per minute for a given 6 hour window. |
Once running and you have collected a handful of metrics, verify that your setup is correct by listing tags on the Atlas server:
$ curl http://ATLAS/api/v1/tags|
Tip
|
After executing several requests against your service, you can gather some very basic information on the request latency of every request by pasting the following url in your browser: http://ATLAS/api/v1/graph?q=name,rest,:eq,:avg
|
The Atlas wiki contains a compilation of sample queries for various scenarios.
Make sure to check out the alerting philosophy and docs on using double exponential smoothing to generate dynamic alert thresholds.