Table of Contents
- 1. Introduction
- 2. Opinionated implementation
- 3. Project opinions
- 4. Concourse Pipeline (Cloud Foundry)
- 5. Concourse Pipeline (Kubernetes)
- 6. Concourse FAQ
- 6.1. Can I use the pipeline for some other repos?
- 6.2. Will this work for ANY project out of the box?
- 6.3. Can I modify this to reuse in my project?
- 6.4. I ran out of resources!! (PCF Dev)
- 6.5. The rollback step fails due to missing JAR ?!
- 6.6. Can I see the output of a job from the terminal?
- 6.7. I clicked the job and it’s constantly pending…
- 6.8. The route is already in use (CF)
- 6.9. I’m unauthorized to deploy infrastructure jars
- 6.10.
versionresource is broken
- 7. Jenkins Pipeline (Common)
- 8. Jenkins Pipeline (Cloud Foundry)
- 9. Jenkins Pipeline (Kubernetes)
- 10. Jenkins FAQ
- 10.1. Pipeline version contains ${PIPELINE_VERSION}
- 10.2. Pipeline version is not passed to the build
- 10.3. The build times out with
pipeline.shinfo - 10.4. Can I use the pipeline for some other repos?
- 10.5. Will this work for ANY project out of the box?
- 10.6. Can I modify this to reuse in my project?
- 10.7. The rollback step fails due to missing JAR ?!
- 10.8. I want to provide a different JDK version
- 10.9. Enable Groovy Token Macro Processing
- 10.10. I want deployment to stage and prod be automatic
- 10.11. I don’t want to test API compativility
- 10.12. I can’t tag the repo!
- 10.13. I’m unauthorized to deploy infrastructure jars
- 10.14. Signing Artifacts
- 10.15. Using SSH keys for git
- 10.16. Deploy to stage fails and doesn’t redeploy a service (Kubernetes)
- 10.17. I ran out of resources!! (Cloud Foundry)
- 10.18. Deploying to test / stage / prod fails - error finding space (Cloud Foundry)
- 10.19. The route is already in use (Cloud Foundry)
- 10.20. How to execute helper scripts against a real CF instance I’m logged into (Cloud Foundry)
- 11. Kubernetes setup
- 12. The demo setup (Cloud Foundry)
- 13. The demo setup (Kubernetes)
- 14. Building the project
- 15. Customizing the project
- 16. Releasing the project
Documentation Authors: Marcin Grzejszczak
Spring, Spring Boot and Spring Cloud are tools that allow developers speed up the time of creating new business features. It’s common knowledge however that the feature is only valuable if it’s in production. That’s why companies spend a lot of time and resources on building their own deployment pipelines.
This project tries to solve the following problems:
- Creation of a common deployment pipeline
- Propagation of good testing & deployment practices
- Speed up the time required to deploy a feature to production
A common way of running, configuring and deploying applications lowers support costs and time needed by new developers to blend in when they change projects.
In the following section we will describe in more depth the rationale behind the presented opinionated pipeline. We will go through each deployment step and describe it in details.
.
├── common
├── concourse
├── docs
└── jenkins
In the common folder you can find all the Bash scripts containing the pipeline logic. These
scripts are reused by both Concourse and Jenkins pipelines.
In the concourse folder you can find all the necessary scripts and setup to run Concourse demo.
In the docs section you have the whole documentation of the project.
In the jenkins folder you can find all the necessary scripts and setup to run Jenkins demo.
This repository can be treated as a template for your pipeline. We provide some opinionated implementation that you can alter to suit your needs. The best approach to use it to build your production projects would be to download the Spring Cloud Pipelines repository as ZIP, then init a Git project there and modify it as you wish.
$ # pass the branch (e.g. master) or a particular tag (e.g. v1.0.0.RELEASE)
$ SC_PIPELINES_RELEASE=...
$ curl -LOk https://github.com/spring-cloud/spring-cloud-pipelines/archive/${SC_PIPELINES_RELEASE}.zip
$ unzip ${SC_PIPELINES_RELEASE}.zip
$ cd spring-cloud-pipelines-${SC_PIPELINES_RELEASE}
$ git init
$ # modify the pipelines to suit your needs
$ git add .
$ git commit -m "Initial commit"
$ git remote add origin ${YOUR_REPOSITORY_URL}
$ git push origin master
![[Note]](images/note.png) | Note |
|---|---|
Why aren’t you simply cloning the repo? This is meant to be a seed for building new, versioned pipelines for you. You don’t want to have all of our history dragged along with you, don’t you? |
You can use Spring Cloud Pipelines to generate pipelines for all projects in your system. You can scan all your repositories (e.g. call the Stash / Github API and retrieve the list of repos) and then…
- For Jenkins, call the seed job and pass the
REPOSparameter that would contain the list of repositories - For Concourse, you’d have to call
flyand set pipeline for every single repo
You can use Spring Cloud Pipelines in such a way that each project contains its own pipeline definition in its code. Spring Cloud Pipelines clones the code with the pipeline definitions (the bash scripts) so the only piece of logic that could be there in your application’s repository would be how the pipeline should look like.
- For Jenkins, you’d have to either set up the
Jenkinsfileor the jobs using Jenkins Job DSL plugin in your repo. Then in Jenkins whenever you set up a new pipeline for a repo then you reference the pipeline definition in that repo. - For Concourse, each project contains its own pipeline steps and it’s up to the project to set up the pipeline.
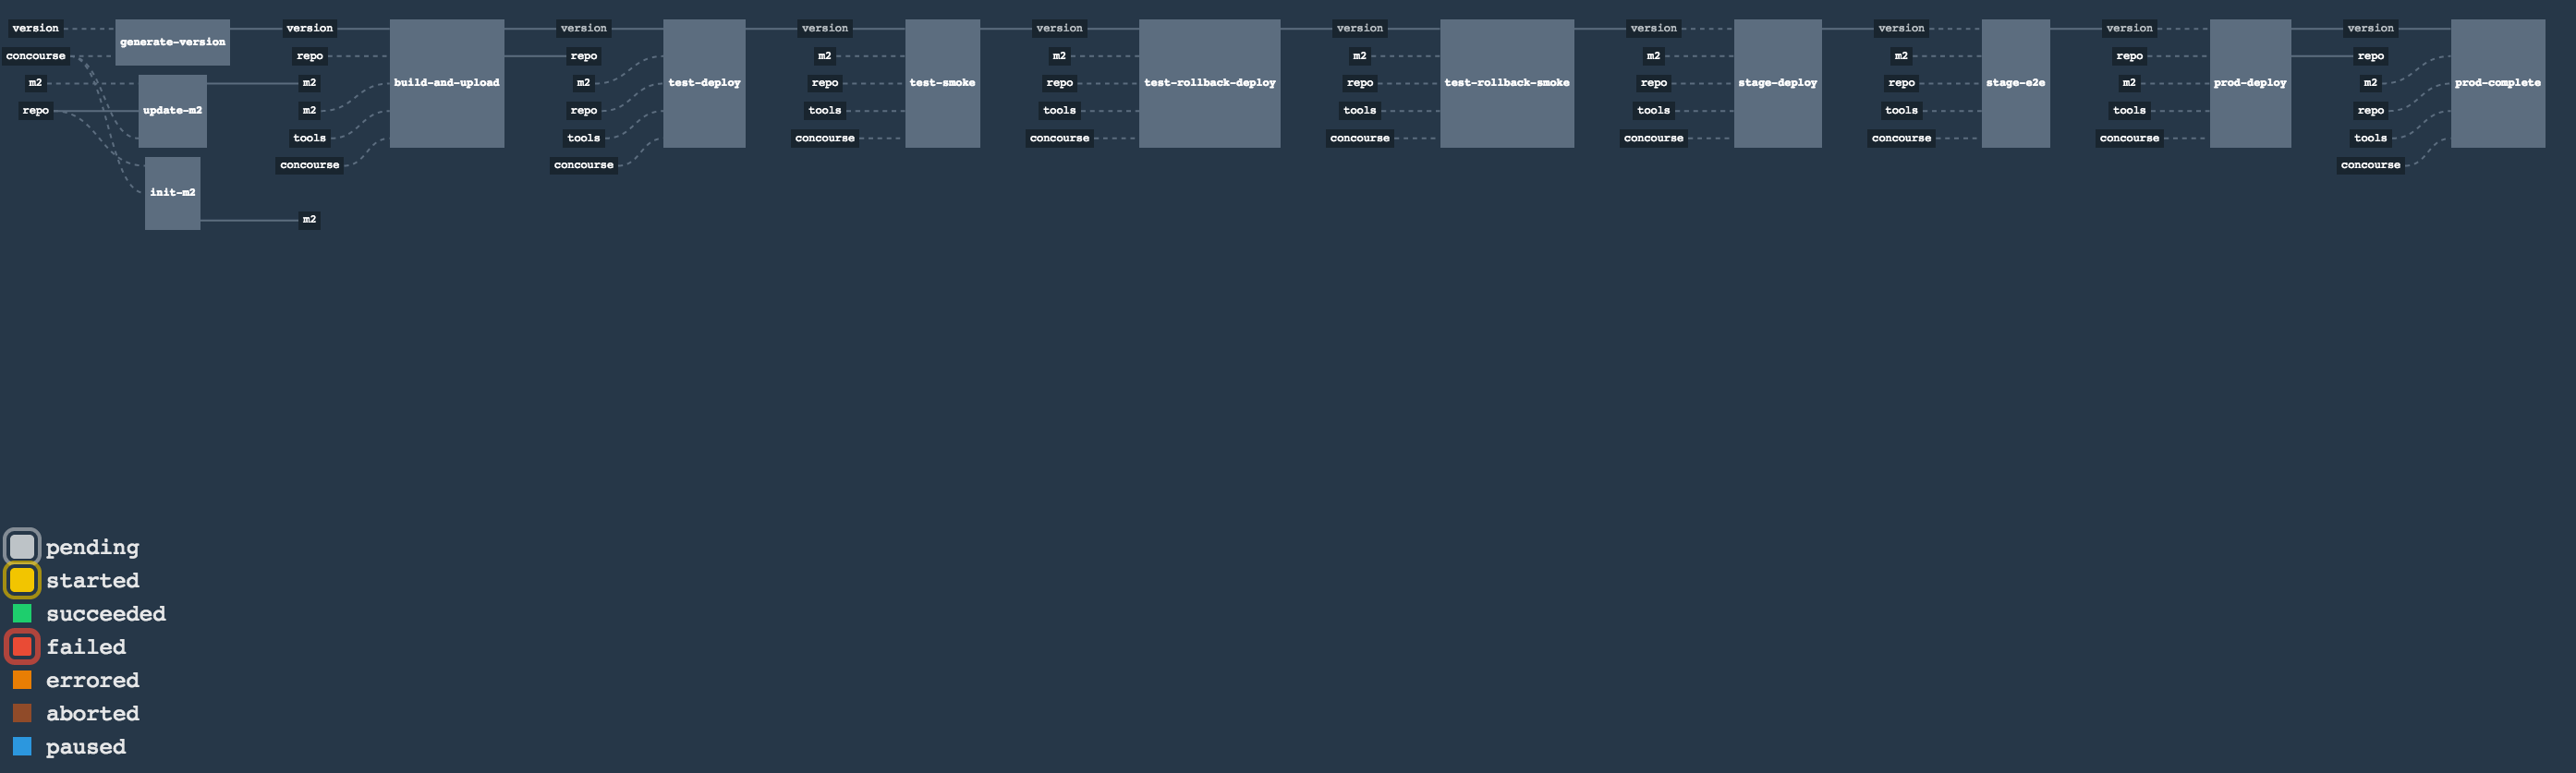
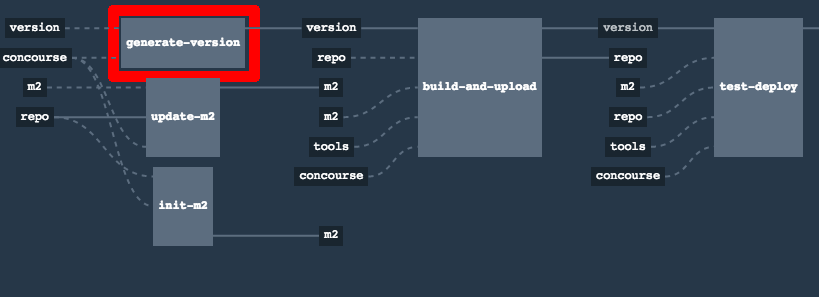
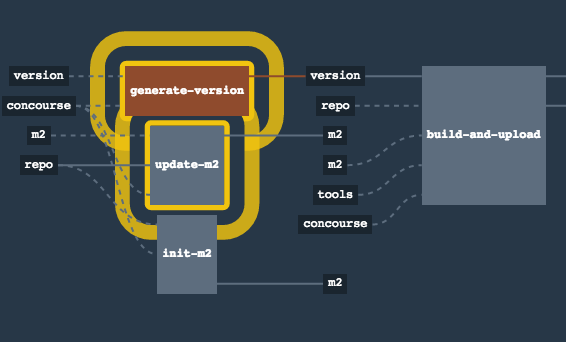
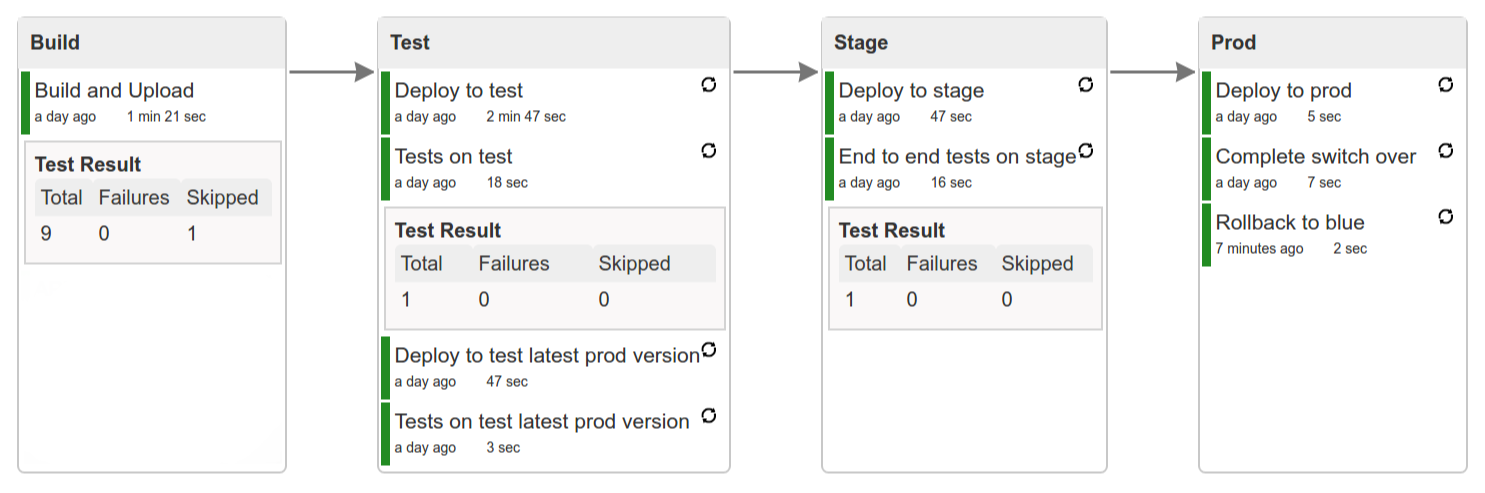
Let’s take a look at the flow of the opinionated pipeline


We’ll first describe the overall concept behind the flow and then we’ll split it into pieces and describe every piece independently.
So we’re on the same page let’s define some common vocabulary. We discern 4 typical environments in terms of running the pipeline.
- build environment is a machine where the building of the application takes place. It’s a CI / CD tool worker.
- test is an environment where you can deploy an application to test it. It doesn’t resemble production, we can’t be sure of it’s state (which application is deployed there and in which version). It can be used by multiple teams at the same time.
- stage is an environment that does resemble production. Most likely applications are deployed there in versions that correspond to those deployed to production. Typically databases there are filled up with (obfuscated) production data. Most often this environment is a single, shared one between many teams. In other words in order to run some performance, user acceptance tests you have to block and wait until the environment is free.
- prod is a production environment where we want our tested applications to be deployed for our customers.
Unit tests - tests that are executed on the application during the build phase. No integrations with databases / HTTP server stubs etc. take place. Generally speaking your application should have plenty of these to have fast feedback if your features are working fine.
Integration tests - tests that are executed on the built application during the build phase. Integrations with in memory databases / HTTP server stubs take place. According to the test pyramid, in most cases you should have not too many of these kind of tests.
Smoke tests - tests that are executed on a deployed application. The concept of these tests is to check the crucial parts of your application are working properly. If you have 100 features in your application but you gain most money from e.g. 5 features then you could write smoke tests for those 5 features. As you can see we’re talking about smoke tests of an application, not of the whole system. In our understanding inside the opinionated pipeline, these tests are executed against an application that is surrounded with stubs.
End to end tests - tests that are executed on a system composing of multiple applications. The idea of these tests is to check if the tested feature works when the whole system is set up. Due to the fact that it takes a lot of time, effort, resources to maintain such an environment and that often those tests are unreliable (due to many different moving pieces like network database etc.) you should have a handful of those tests. Only for critical parts of your business. Since only production is the key verifier of whether your feature works, some companies don’t even want to do those and move directly to deployment to production. When your system contains KPI monitoring and alerting you can quickly react when your deployed application is not behaving properly.
Performance testing - tests executed on an application or set of applications to check if your system can handle big load of input. In case of our opinionated pipeline these tests could be executed either on test (against stubbed environment) or stage (against the whole system)
Before we go into details of the flow let’s take a look at the following example.
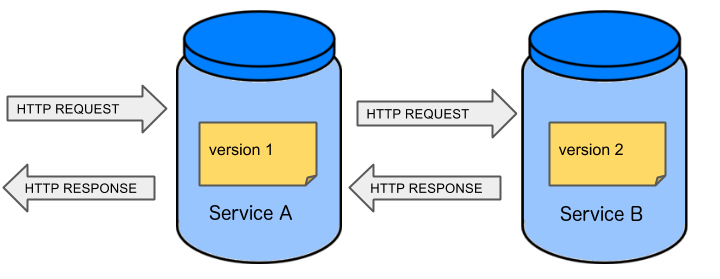
When having only a handful of applications, performing end to end testing is beneficial. From the operations perspective it’s maintainable for a finite number of deployed instances. From the developers perspective it’s nice to verify the whole flow in the system for a feature.
In case of microservices the scale starts to be a problem:
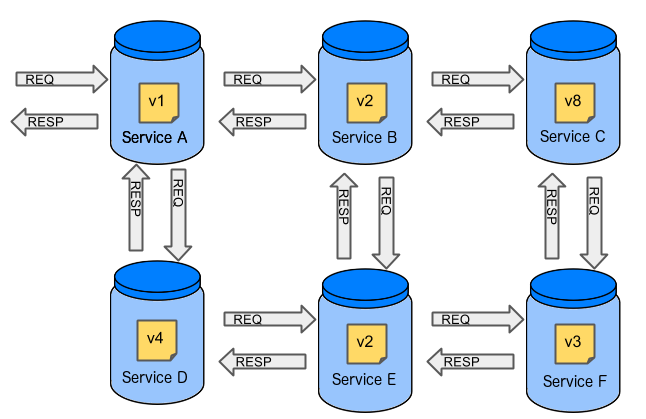
The questions arise:
Should I queue deployments of microservices on one testing environment or should I have an environment per microservice?
- If I queue deployments people will have to wait for hours to have their tests ran - that can be a problem
To remove that issue I can have an environment per microservice
- Who will pay the bills (imagine 100 microservices - each having each own environment).
- Who will support each of those environments?
- Should we spawn a new environment each time we execute a new pipeline and then wrap it up or should we have them up and running for the whole day?
In which versions should I deploy the dependent microservices - development or production versions?
- If I have development versions then I can test my application against a feature that is not yet on production. That can lead to exceptions on production
- If I test against production versions then I’ll never be able to test against a feature under development anytime before deployment to production.
One of the possibilities of tackling these problems is to… not do end to end tests.
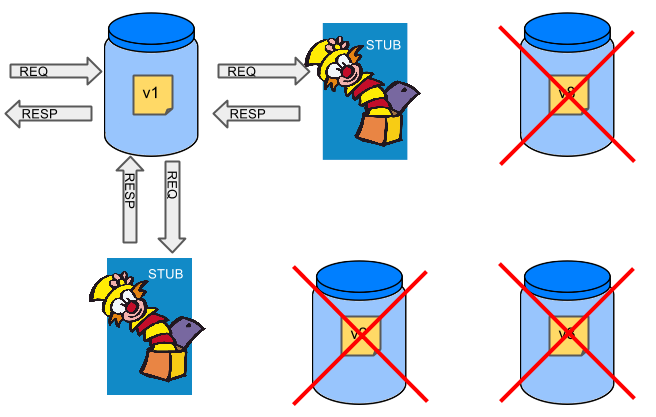
If we stub out all the dependencies of our application then most of the problems presented above disappear. There is no need to start and setup infrastructure required by the dependant microservices. That way the testing setup looks like this:
Such an approach to testing and deployment gives the following benefits (thanks to the usage of Spring Cloud Contract):
- No need to deploy dependant services
- The stubs used for the tests ran on a deployed microservice are the same as those used during integration tests
- Those stubs have been tested against the application that produces them (check Spring Cloud Contract for more information)
- We don’t have many slow tests running on a deployed application - thus the pipeline gets executed much faster
- We don’t have to queue deployments - we’re testing in isolation thus pipelines don’t interfere with each other
- We don’t have to spawn virtual machines each time for deployment purposes
It brings however the following challenges:
- No end to end tests before production - you don’t have the full certainty that a feature is working
- First time the applications will talk in a real way will be on production
Like every solution it has its benefits and drawbacks. The opinionated pipeline allows you to configure whether you want to follow this flow or not.
The general view behind this deployment pipeline is to:
- test the application in isolation
- test the backwards compatibility of the application in order to roll it back if necessary
- allow testing of the packaged app in a deployed environment
- allow user acceptance tests / performance tests in a deployed environment
- allow deployment to production
Obviously the pipeline could have been split to more steps but it seems that all of the aforementioned actions comprise nicely in our opinionated proposal.
Spring Cloud Pipelines uses Bash scripts extensively. Below you can find the list of software that needs to be installed on a CI server worker for the build to pass.
![[Tip]](images/tip.png) | Tip |
|---|---|
In the demo setup all of these libraries are already installed. |
 apt-get -y install \
    bash \
    git \
    tar \
    zip \
    curl \
    ruby \
    wget \
    unzip \
    python \
jq![[Important]](images/important.png) | Important |
|---|---|
In the Jenkins case you will also need |
Each application can contain a file called sc-pipelines.yml with the following structure:
lowercaseEnvironmentName1:
    services:
        - type: service1Type
          name: service1Name
          coordinates: value
        - type: service2Type
          name: service2Name
          key: value
lowercaseEnvironmentName2:
    services:
        - type: service3Type
          name: service3Name
          coordinates: value
        - type: service4Type
          name: service4Name
          key: value
For a given environment we declare a list of infrastructure services that we want to have deployed. Services have
type(example:eureka,mysql,rabbitmq,stubrunner) - this value gets then applied to thedeployServiceBash function- [KUBERNETES] for
mysqlyou can pass the database name via thedatabaseproperty name- name of the service to get deployedcoordinates- coordinate that allows you to fetch the binary of the service. Examples: It can be a maven coordinategroupid:artifactid:version, docker imageorganization/nameOfImage, etc.- arbitrary key value pairs - you can customize the services as you wish
The stubrunner type can also have the useClasspath flag turned on to true
or false.
Example:
test:
  services:
    - type: rabbitmq
      name: rabbitmq-github-webhook
    - type: mysql
      name: mysql-github-webhook
    - type: eureka
      name: eureka-github-webhook
      coordinates: com.example.eureka:github-eureka:0.0.1.M1
    - type: stubrunner
      name: stubrunner-github-webhook
      coordinates: com.example.eureka:github-analytics-stub-runner-boot-classpath-stubs:0.0.1.M1
      useClasspath: true
stage:
  services:
    - type: rabbitmq
      name: rabbitmq-github
    - type: mysql
      name: mysql-github
    - type: eureka
      name: github-eureka
      coordinates: com.example.eureka:github-eureka:0.0.1.M1
When the deployment to test or deployment to stage occurs, Spring Cloud Pipelines will:
- for
testenvironment, delete existing services and redeploy the ones from the list - for
stageenvironment, if the service is not available it will get deployed. Otherwise nothing will happen
For the demo purposes we’re providing Docker Compose setup with Artifactory and Concourse / Jenkins tools. Regardless of the picked CD application for the pipeline to pass one needs either
- a Cloud Foundry instance (for example Pivotal Web Services or PCF Dev)
- a Kubernetes cluster (for example Minikube)
- the infrastructure applications deployed to the JAR hosting application (for the demo we’re providing Artifactory).
Eurekafor Service DiscoveryStub Runner Bootfor running Spring Cloud Contract stubs.
| Tip |
|---|---|
In the demos we’re showing you how to first build the |
In this step we’re generating a version of the pipeline, next we’re running unit, integration and contract tests. Finally we’re:
- publishing a fat jar of the application
- publishing a Spring Cloud Contract jar containing stubs of the application
- for Kubernetes - uploading a Docker image of the application
During this phase we’re executing a Maven build using Maven Wrapper or a Gradle build using Gradle Wrapper
, with unit and integration tests. We’re also tagging the repository with dev/${version} format. That way in each
subsequent step of the pipeline we’re able to retrieve the tagged version. Also we know
exactly which version of the pipeline corresponds to which Git hash.
Once the artifact got built we’re running API compatibility check.
- we’re searching for the latest production deployment
- we’re retrieving the contracts that were used by that deployment
- from the contracts we’re generating API tests to see if the current implementation is fulfilling the HTTP / messaging contracts that the current production deployment has defined (we’re checking backward compatibility of the API)
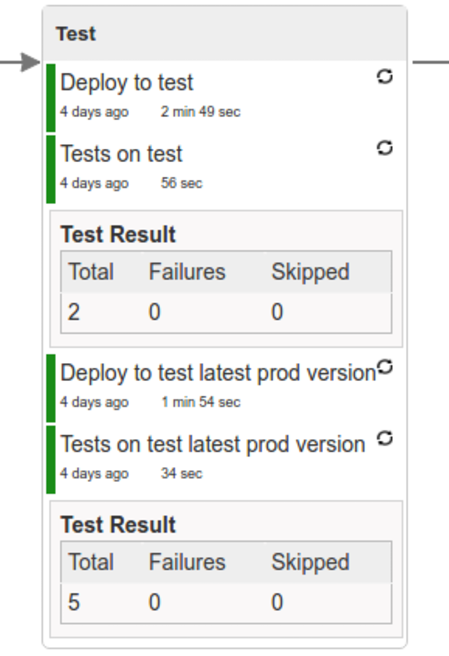
Here we’re
- starting a RabbitMQ service in PaaS
- deploying
Eurekainfrastructure application to PaaS - downloading the fat jar from Nexus and we’re uploading it to PaaS. We want the application to run in isolation (be surrounded by stubs).
| Tip |
|---|---|
Currently due to port constraints in Cloud Foundry
we cannot run multiple stubbed HTTP services in the cloud so to fix this issue we’re running
the application with |
- if the application is using a database then it gets upgraded at this point via Flyway, Liquibase or any other tool once the application gets started
- from the project’s Maven or Gradle build we’re extracting
stubrunner.idsproperty that contains all thegroupId:artifactId:version:classifiernotation of dependant projects for which the stubs should be downloaded. - then we’re uploading
Stub Runner Bootand pass the extractedstubrunner.idsto it. That way we’ll have a running application in Cloud Foundry that will download all the necessary stubs of our application - from the checked out code we’re running the tests available under the
smokeprofile. In the case ofGitHub Analyticsapplication we’re triggering a message from theGitHub Webhookapplication’s stub, that is sent via RabbitMQ to GitHub Analytics. Then we’re checking if message count has increased. - once the tests pass we’re searching for the last production release. Once the application
is deployed to production we’re tagging it with
prod/${version}tag. If there is no such tag (there was no production release) there will be no rollback tests executed. If there was a production release the tests will get executed. - assuming that there was a production release we’re checking out the code corresponding to that release (we’re checking out the tag), we’re downloading the appropriate artifact (either JAR for Cloud Foundry or Docker image for Kubernetes) and we’re uploading it to PaaS. IMPORTANT the old artifact is running against the NEW version of the database.
- we’re running the old
smoketests against the freshly deployed application surrounded by stubs. If those tests pass then we have a high probability that the application is backwards compatible - the default behaviour is that after all of those steps the user can manually click to deploy the application to a stage environment
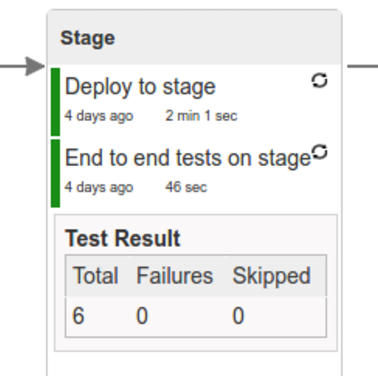
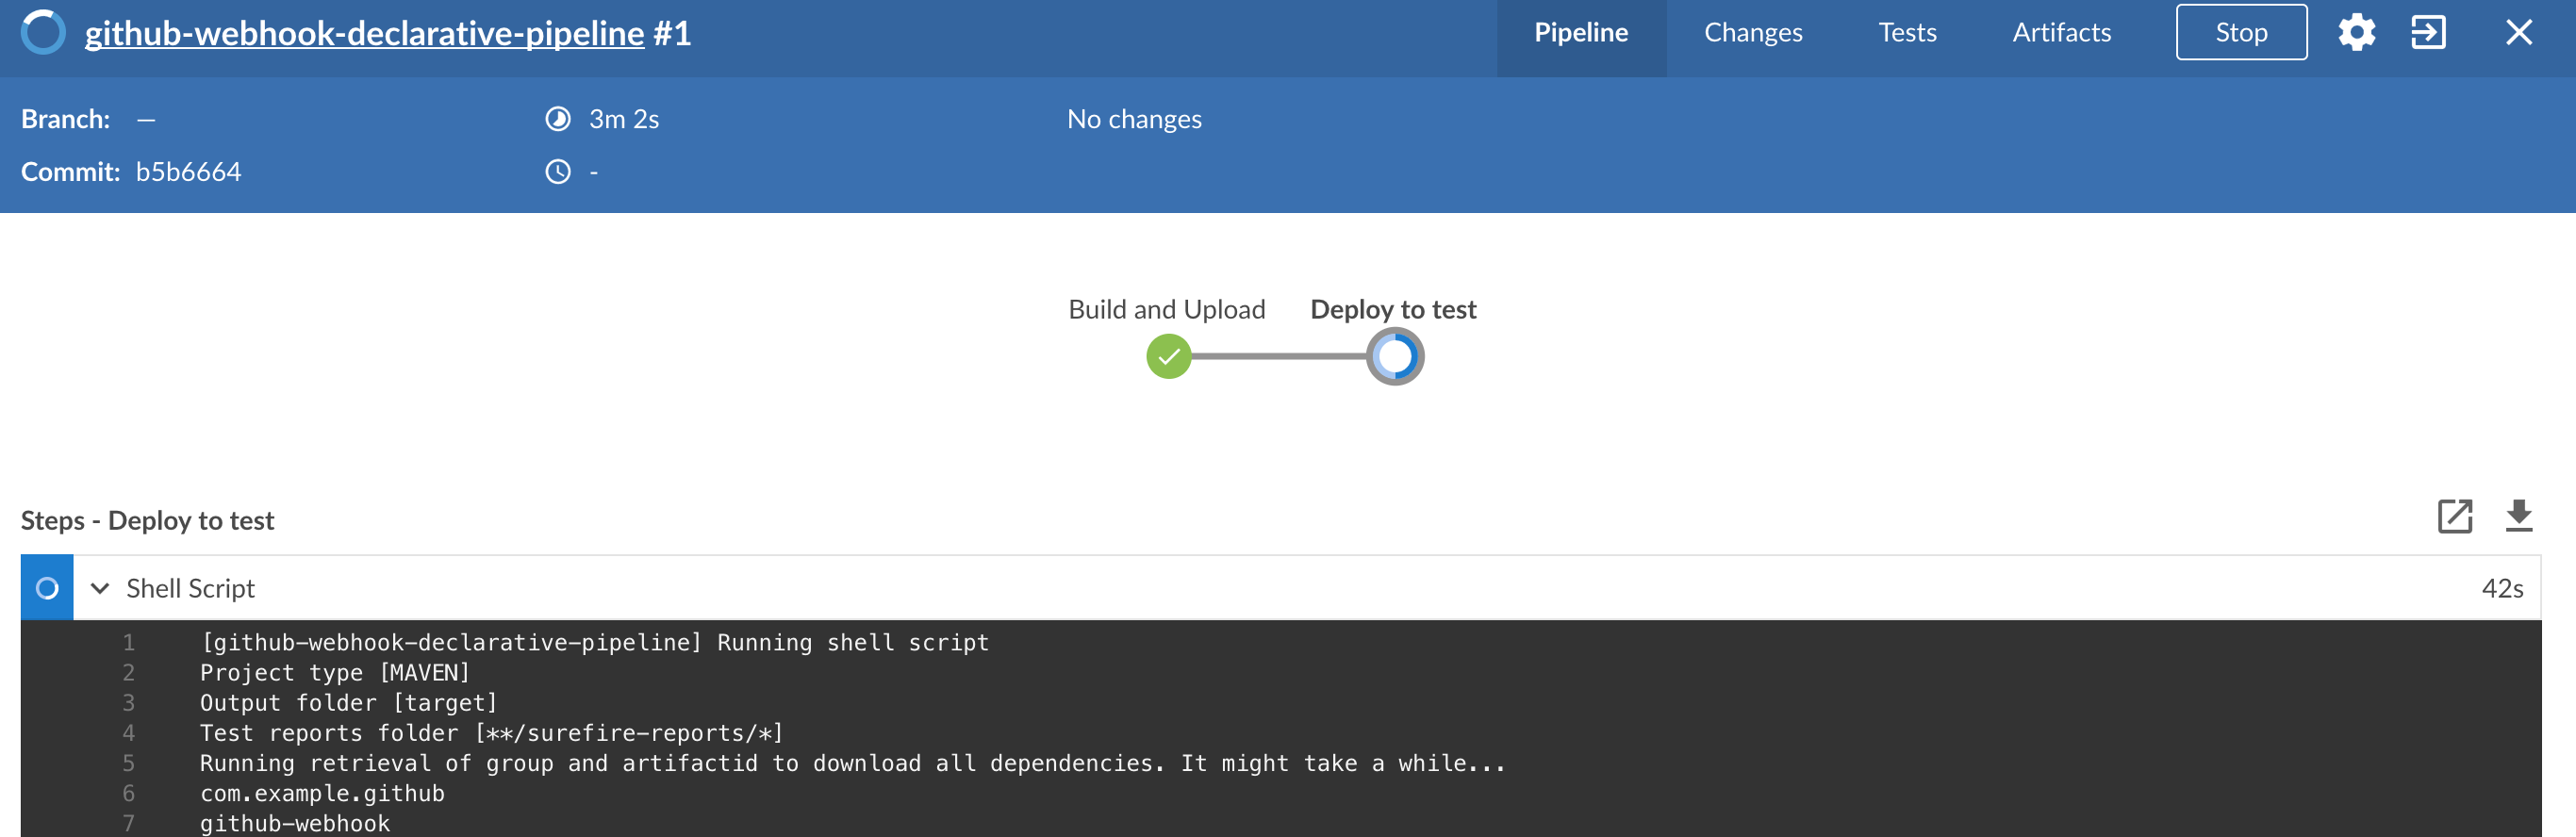
Here we’re
- starting a RabbitMQ service in PaaS
- deploying
Eurekainfrastructure application to PaaS - downloading the artifact (either JAR for Cloud Foundry or Docker image for Kubernetes) from and we’re uploading it to PaaS.
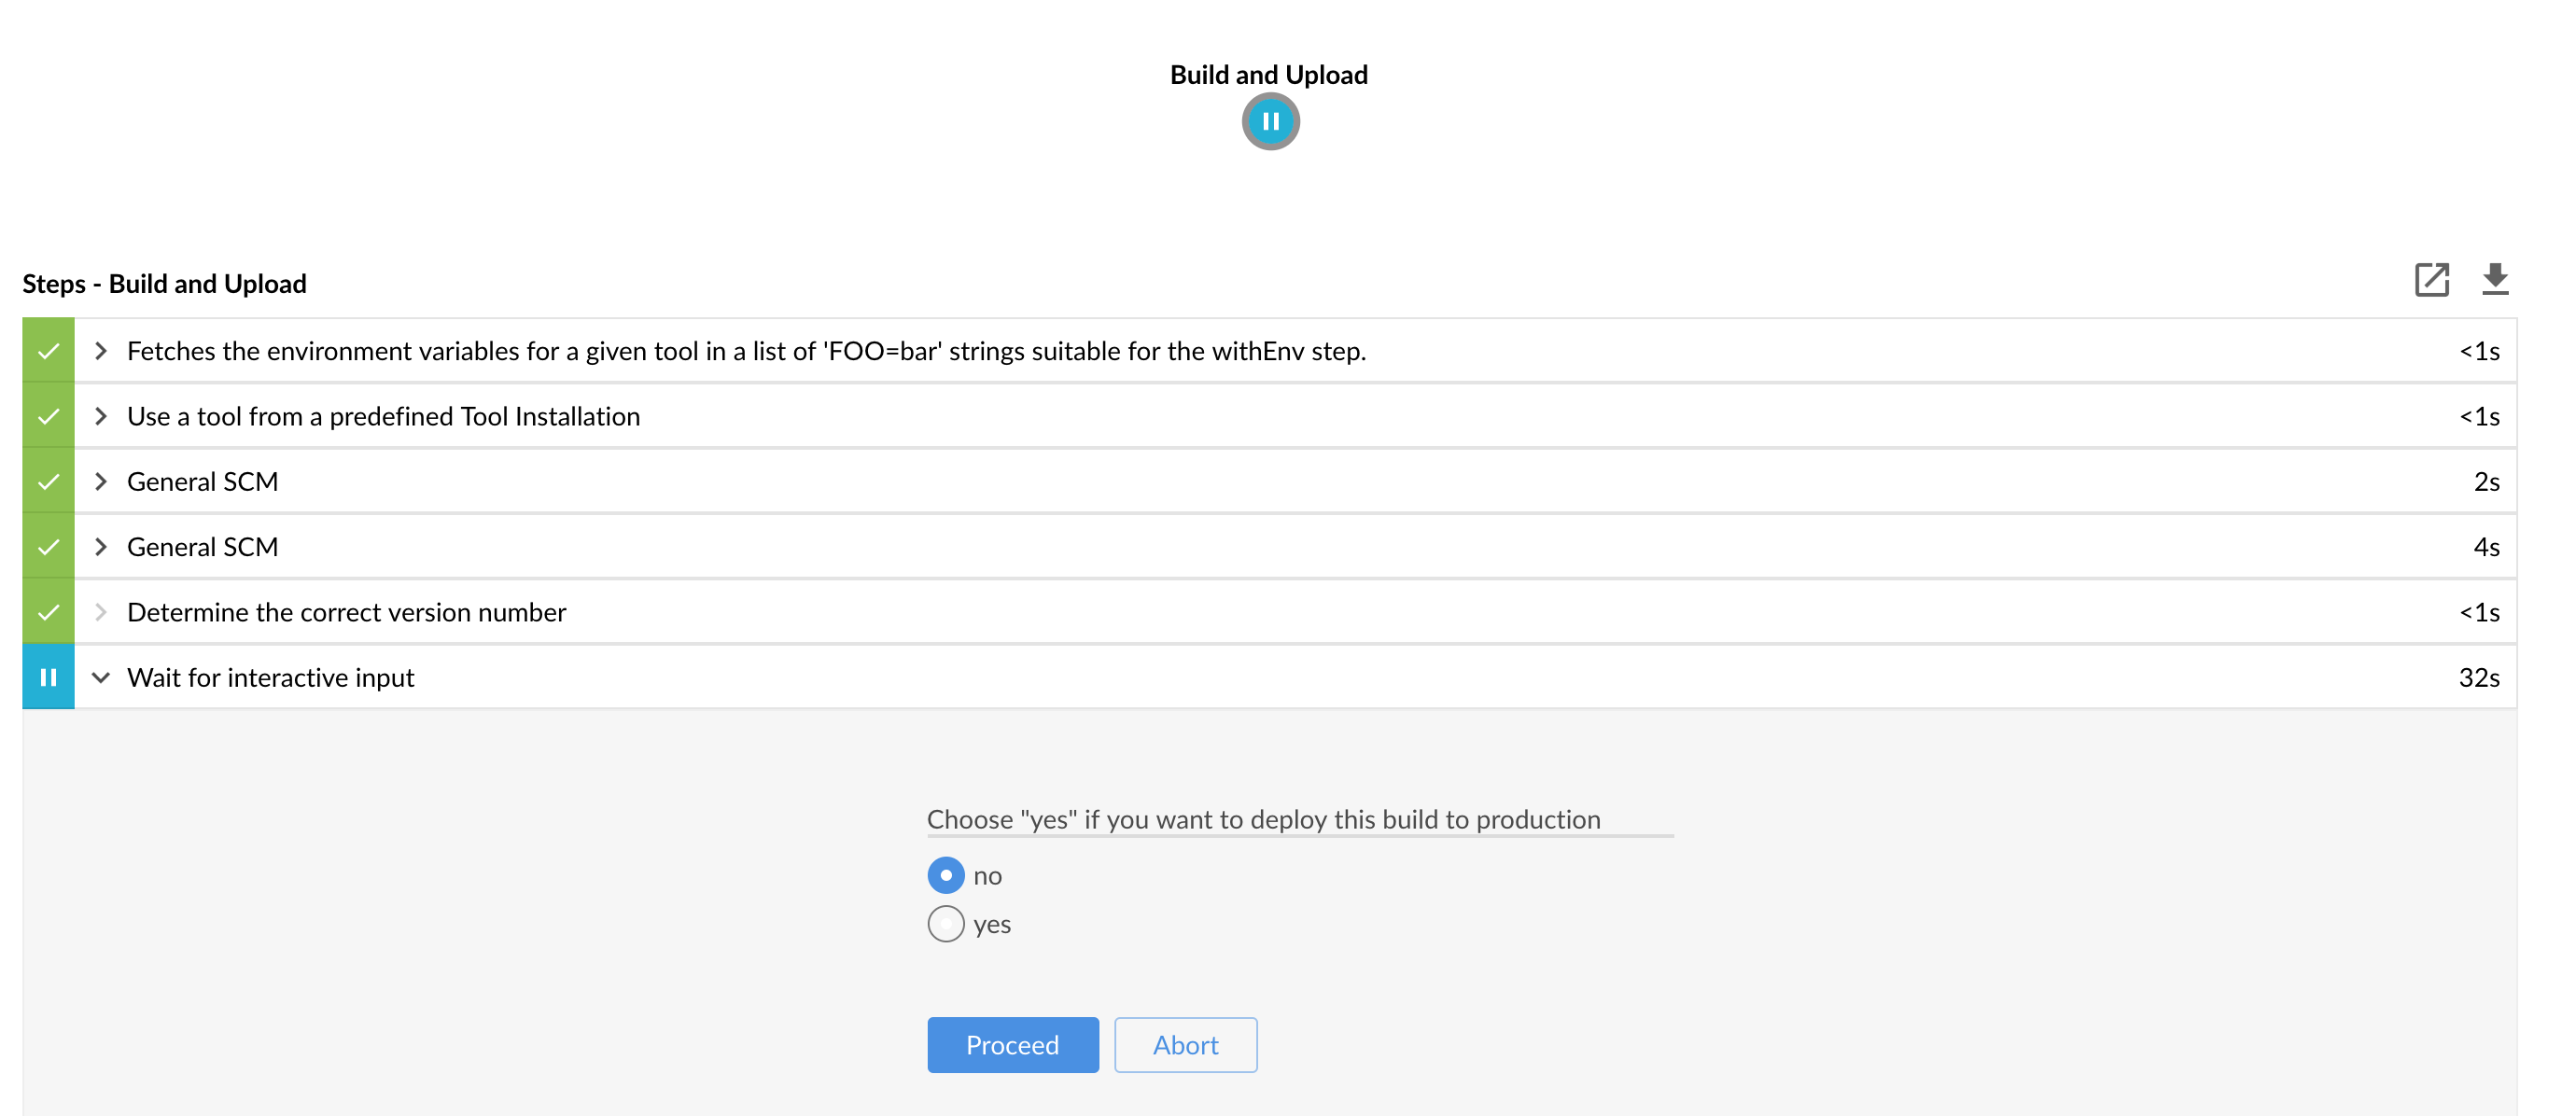
Next we have a manual step in which:
- from the checked out code we’re running the tests available under the
e2eprofile. In the case ofGitHub Analyticsapplication we’re sending a HTTP message to GitHub Analytic’s endpoint. Then we’re checking if the received message count has increased.
The step is manual by default due to the fact that stage environment is often shared between teams and some preparations on databases / infrastructure have to take place before running the tests. Ideally these step should be fully automatic.
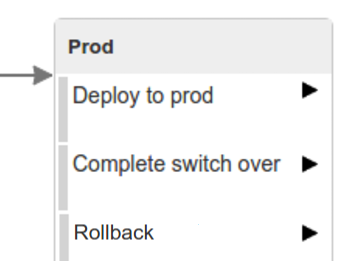
The step to deploy to production is manual but ideally it should be automatic.
| Important |
|---|---|
This step does deployment to production. On production you would assume
that you have the infrastructure running. That’s why before you run this step you
must execute a script that will provision the services on the production environment.
For |
Here we’re
- tagging the Git repo with
prod/${version}tag - downloading the application artifact (either JAR for Cloud Foundry or Docker image for Kubernetes)
- we’re doing Blue Green deployment:
for Cloud Foundry
- we’re renaming the current instance of the app e.g.
fooServicetofooService-venerable - we’re deploying the new instance of the app under the
fooServicename - now two instances of the same application are running on production
- we’re renaming the current instance of the app e.g.
for Kubernetes
- we’re deploying a service with the name of the app e.g.
fooService - we’re doing a deployment with the name of the app with version suffix (with the name escaped
to fulfill the DNS name requirements) e.g.
fooService-1-0-0-M1-123-456-VERSION - all deployments of the same application have the same label
nameequal to app name e.g.fooService - the service is routing the traffic basing on the
namelabel selector - now two instances of the same application are running on production
- we’re deploying a service with the name of the app e.g.
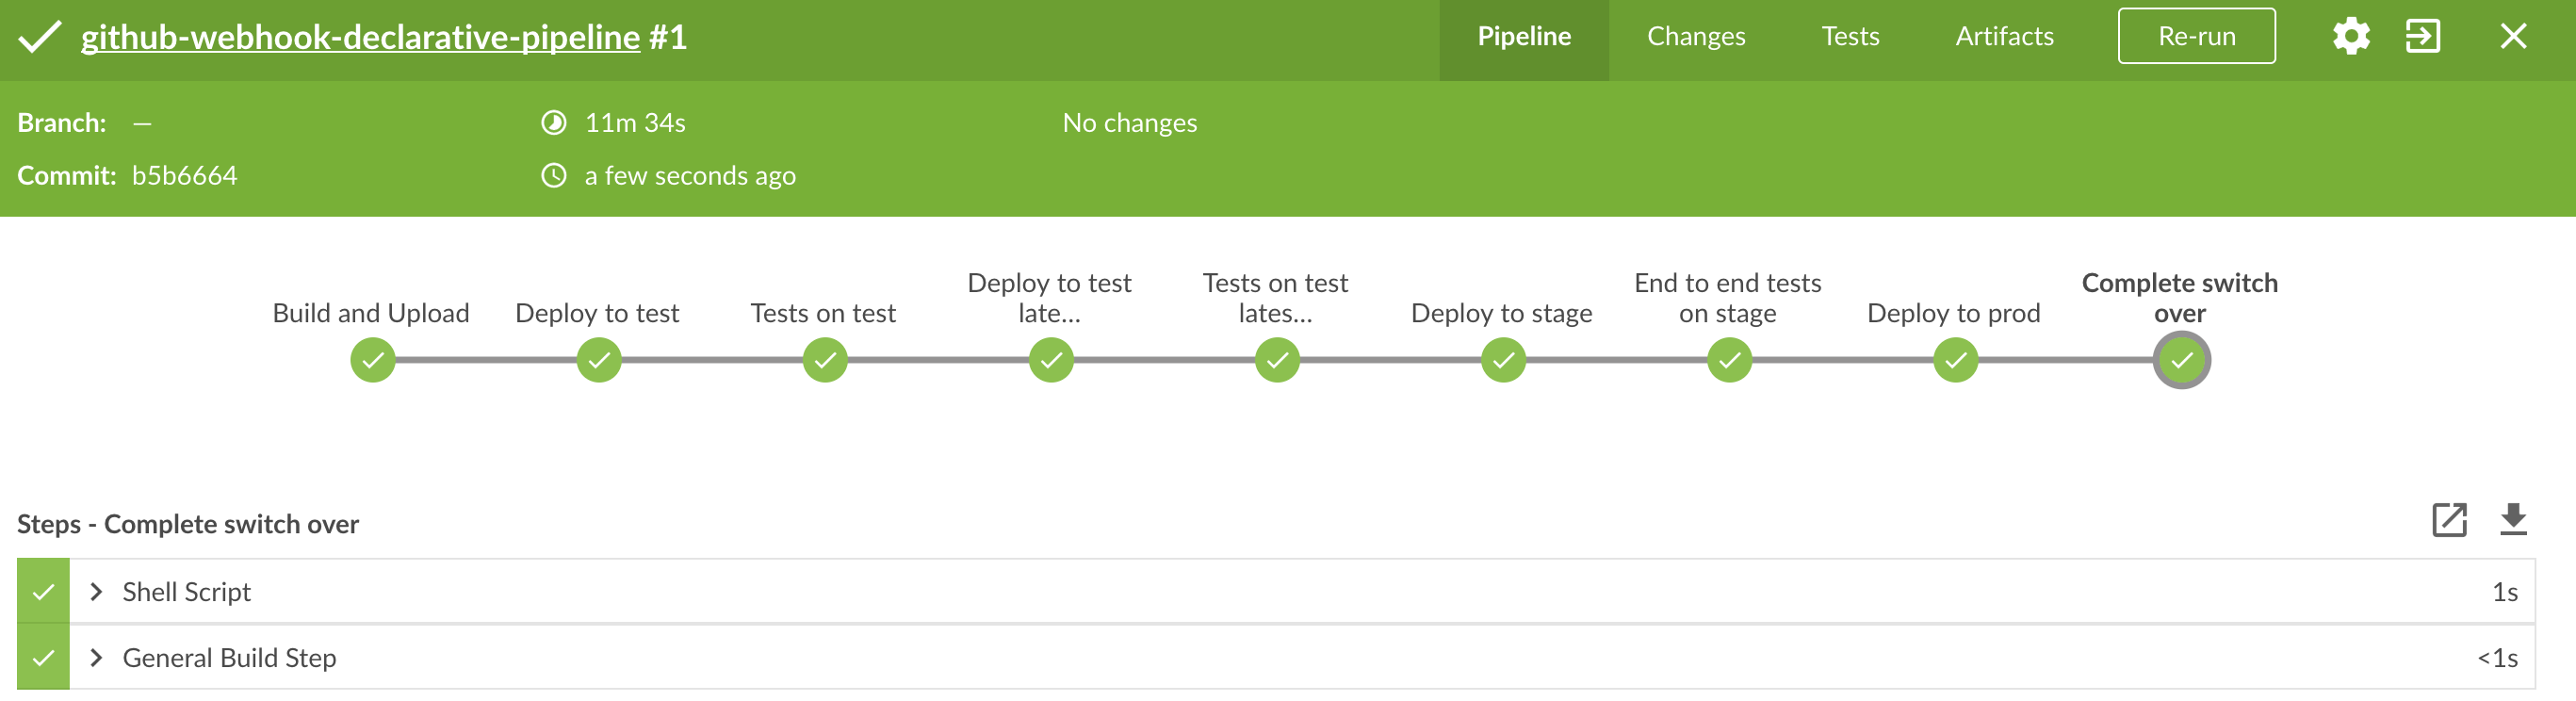
in the
Complete switch overwhich is a manual step- we’re deleting the old instance
- remember to run this step only after you have confirmed that both instances are working fine!
- now two instances of the same application are running on production
in the
Rollback to bluewhich is a manual step- we’re routing all the traffic to the old instance
- in CF we do that by ensuring that blue is running and stopping green
- in K8S we do that by scaling the number of instances of green to 0
- this step will set the state of your system to such where most likely some manual intervention should take place (to restart some applications, redeploy them, etc.)
In this section we will go through the assumptions we’ve made in the project structure and project properties.
We’ve taken the following opinionated decisions for a Cloud Foundry based project:
- application built using Maven or Gradle wrappers
- application deployment to Cloud Foundry
For Maven (example project):
- usage of Maven Wrapper
settings.xmlis parametrized to pass the credentials to push code to ArtifactoryM2_SETTINGS_REPO_ID- server id for Artifactory / Nexus deploymentM2_SETTINGS_REPO_USERNAME- username for Artifactory / Nexus deploymentM2_SETTINGS_REPO_PASSWORD- password for Artifactory / Nexus deployment
- artifacts deployment by
./mvnw clean deploy stubrunner.idsproperty to retrieve list of collaborators for which stubs should be downloadedrepo.with.binariesproperty - (Injected by the pipeline) will contain the URL to the repo containing binaries (e.g. Artifactory)distribution.management.release.idproperty - (Injected by the pipeline) ID of the distribution management. Corresponds to server id insettings.xmldistribution.management.release.urlproperty - (Injected by the pipeline) Will contain the URL to the repo containing binaries (e.g. Artifactory)- running API compatibility tests via the
apicompatibilityMaven profile latest.production.versionproperty - (Injected by the pipeline) will contain the latest production version for the repo (retrieved from Git tags)- running smoke tests on a deployed app via the
smokeMaven profile - running end to end tests on a deployed app via the
e2eMaven profile
For Gradle (example project check the
gradle/pipeline.gradlefile):- usage of Gradlew Wrapper
deploytask for artifacts deploymentREPO_WITH_BINARIESenv var - (Injected by the pipeline) will contain the URL to the repo containing binaries (e.g. Artifactory)M2_SETTINGS_REPO_USERNAMEenv var - Username used to send the binary to the repo containing binaries (e.g. Artifactory)M2_SETTINGS_REPO_PASSWORDenv var - Password used to send the binary to the repo containing binaries (e.g. Artifactory)- running API compatibility tests via the
apiCompatibilitytask latestProductionVersionproperty - (Injected by the pipeline) will contain the latest production version for the repo (retrieved from Git tags)- running smoke tests on a deployed app via the
smoketask - running end to end tests on a deployed app via the
e2etask groupIdtask to retrieve group idartifactIdtask to retrieve artifact idcurrentVersiontask to retrieve the current versionstubIdstask to retrieve list of collaborators for which stubs should be downloaded
We’ve taken the following opinionated decisions for a Cloud Foundry based project:
- application built using Maven or Gradle wrappers
- application deployment to Kubernetes
- The produced Java Docker image needs to allow passing of system properties via
SYSTEM_PROPSenv variable For Maven (example project):
- usage of Maven Wrapper
settings.xmlis parametrized to pass the credentials to push code to Artifactory and Docker repositoryM2_SETTINGS_REPO_ID- server id for Artifactory / Nexus deploymentM2_SETTINGS_REPO_USERNAME- username for Artifactory / Nexus deploymentM2_SETTINGS_REPO_PASSWORD- password for Artifactory / Nexus deploymentDOCKER_SERVER_ID- server id for Docker image pushingDOCKER_USERNAME- username for Docker image pushingDOCKER_PASSWORD- password for Docker image pushingDOCKER_EMAIL- email for Artifactory / Nexus deployment
DOCKER_REGISTRY_URLenv var - (Overridable - defaults to DockerHub) URL of the Docker registryDOCKER_REGISTRY_ORGANIZATION- env var containing the organization where your Docker repo lays- artifacts and Docker image deployment by
./mvnw clean deploy stubrunner.idsproperty to retrieve list of collaborators for which stubs should be downloadedrepo.with.binariesproperty - (Injected by the pipeline) will contain the URL to the repo containing binaries (e.g. Artifactory)distribution.management.release.idproperty - (Injected by the pipeline) ID of the distribution management. Corresponds to server id insettings.xmldistribution.management.release.urlproperty - (Injected by the pipeline) Will contain the URL to the repo containing binaries (e.g. Artifactory)deployment.ymlcontains the Kubernetes deployment descriptorservice.ymlcontains the Kubernetes service descriptor- running API compatibility tests via the
apicompatibilityMaven profile latest.production.versionproperty - (Injected by the pipeline) will contain the latest production version for the repo (retrieved from Git tags)- running smoke tests on a deployed app via the
smokeMaven profile - running end to end tests on a deployed app via the
e2eMaven profile
For Gradle (example project check the
gradle/pipeline.gradlefile):- usage of Gradlew Wrapper
deploytask for artifacts deploymentREPO_WITH_BINARIESenv var - (Injected by the pipeline) will contain the URL to the repo containing binaries (e.g. Artifactory)M2_SETTINGS_REPO_USERNAMEenv var - Username used to send the binary to the repo containing binaries (e.g. Artifactory)M2_SETTINGS_REPO_PASSWORDenv var - Password used to send the binary to the repo containing binaries (e.g. Artifactory)DOCKER_REGISTRY_URLenv var - (Overridable - defaults to DockerHub) URL of the Docker registryDOCKER_USERNAMEenv var - Username used to send the the Docker imageDOCKER_PASSWORDenv var - Password used to send the the Docker imageDOCKER_EMAILenv var - Email used to send the the Docker imageDOCKER_REGISTRY_ORGANIZATION- env var containing the organization where your Docker repo laysdeployment.ymlcontains the Kubernetes deployment descriptorservice.ymlcontains the Kubernetes service descriptor- running API compatibility tests via the
apiCompatibilitytask latestProductionVersionproperty - (Injected by the pipeline) will contain the latest production version for the repo (retrieved from Git tags)- running smoke tests on a deployed app via the
smoketask - running end to end tests on a deployed app via the
e2etask groupIdtask to retrieve group idartifactIdtask to retrieve artifact idcurrentVersiontask to retrieve the current versionstubIdstask to retrieve list of collaborators for which stubs should be downloaded
| Important |
|---|---|
In this chapter we assume that you perform deployment of your application to Cloud Foundry PaaS |
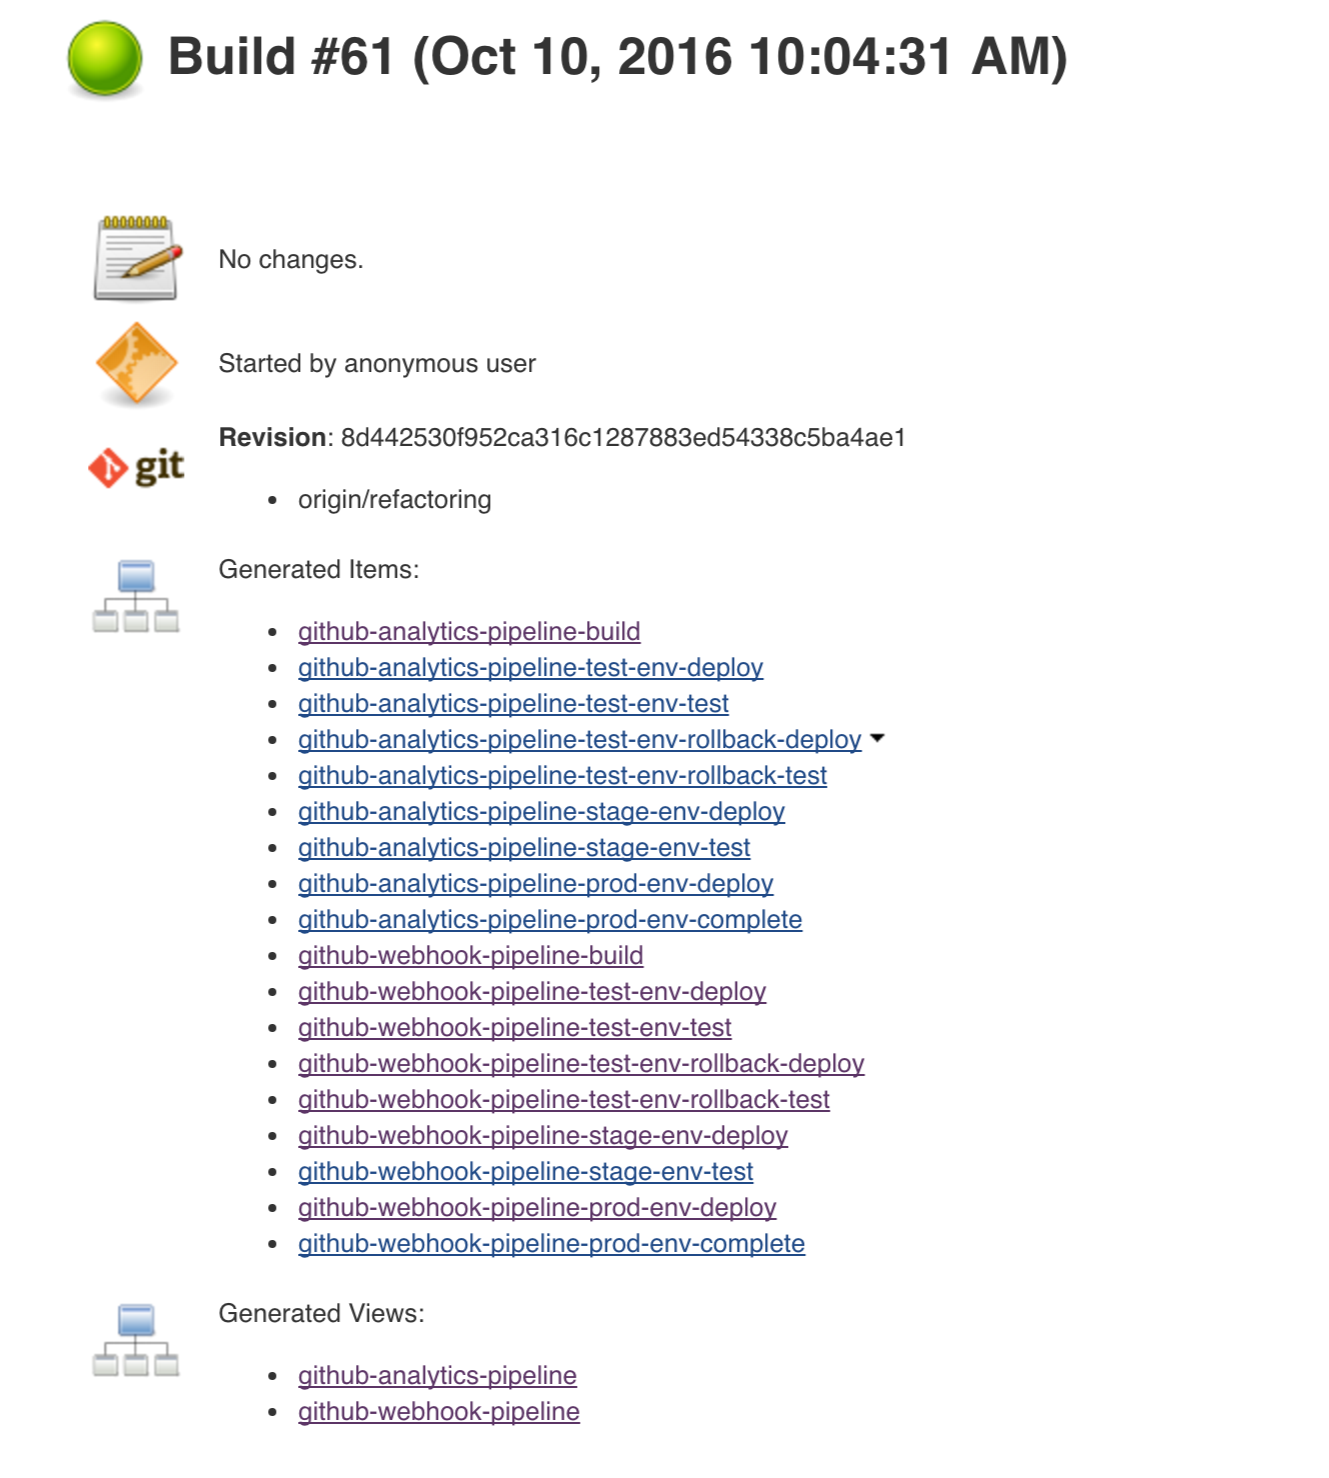
The Spring Cloud Pipelines repository contains opinionated Concourse pipeline definition. Those jobs will form an empty pipeline and a sample, opinionated one that you can use in your company.
All in all there are the following projects taking part in the whole microservice setup for this demo.
- Github Analytics - the app that has a REST endpoint and uses messaging. Our business application.
- Github Webhook - project that emits messages that are used by Github Analytics. Our business application.
- Eureka - simple Eureka Server. This is an infrastructure application.
- Github Analytics Stub Runner Boot - Stub Runner Boot server to be used for tests with Github Analytics. Uses Eureka and Messaging. This is an infrastructure application.
If you want to just run the demo as far as possible using PCF Dev and Docker Compose
There are 4 apps that are composing the pipeline
You need to fork only these. That’s because only then will your user be able to tag and push the tag to repo.
Concourse + Artifactory can be run locally. To do that just execute the
start.sh script from this repo.
git clone https://github.com/spring-cloud/spring-cloud-pipelines
cd spring-cloud-pipelines/concourse
./setup_docker_compose.sh
./start.sh 192.168.99.100
The setup_docker_compose.sh script should be executed once only to allow
generation of keys.
The 192.168.99.100 param is an example of an external URL of Concourse
(equal to Docker-Machine ip in this example).
Then Concourse will be running on port 8080 and Artifactory 8081.
When Artifactory is running, just execute the tools/deploy-infra.sh script from this repo.
git clone https://github.com/spring-cloud/spring-cloud-pipelines
cd spring-cloud-pipelines/
./tools/deploy-infra.sh
As a result both eureka and stub runner repos will be cloned, built
and uploaded to Artifactory.
| Tip |
|---|---|
You can skip this step if you have CF installed and don’t want to use PCF Dev The only thing you have to do is to set up spaces. |
![[Warning]](images/warning.png) | Warning |
|---|---|
It’s more than likely that you’ll run out of resources when you reach stage step. Don’t worry! Keep calm and clear some apps from PCF Dev and continue. |
You have to download and start PCF Dev. A link how to do it is available here.
The default credentials when using PCF Dev are:
username: user
password: pass
email: user
org: pcfdev-org
space: pcfdev-space
api: api.local.pcfdev.io
You can start the PCF Dev like this:
cf dev start
You’ll have to create 3 separate spaces (email admin, pass admin)
cf login -a https://api.local.pcfdev.io --skip-ssl-validation -u admin -p admin -o pcfdev-org

cf create-space pcfdev-test
cf set-space-role user pcfdev-org pcfdev-test SpaceDeveloper
cf create-space pcfdev-stage
cf set-space-role user pcfdev-org pcfdev-stage SpaceDeveloper
cf create-space pcfdev-prod
cf set-space-role user pcfdev-org pcfdev-prod SpaceDeveloper
You can also execute the ./tools/cf-helper.sh setup-spaces to do this.
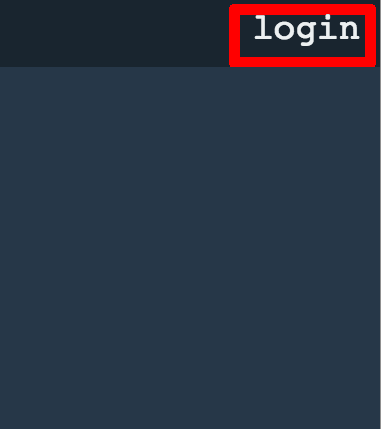
If you go to Concourse website you should see sth like this:
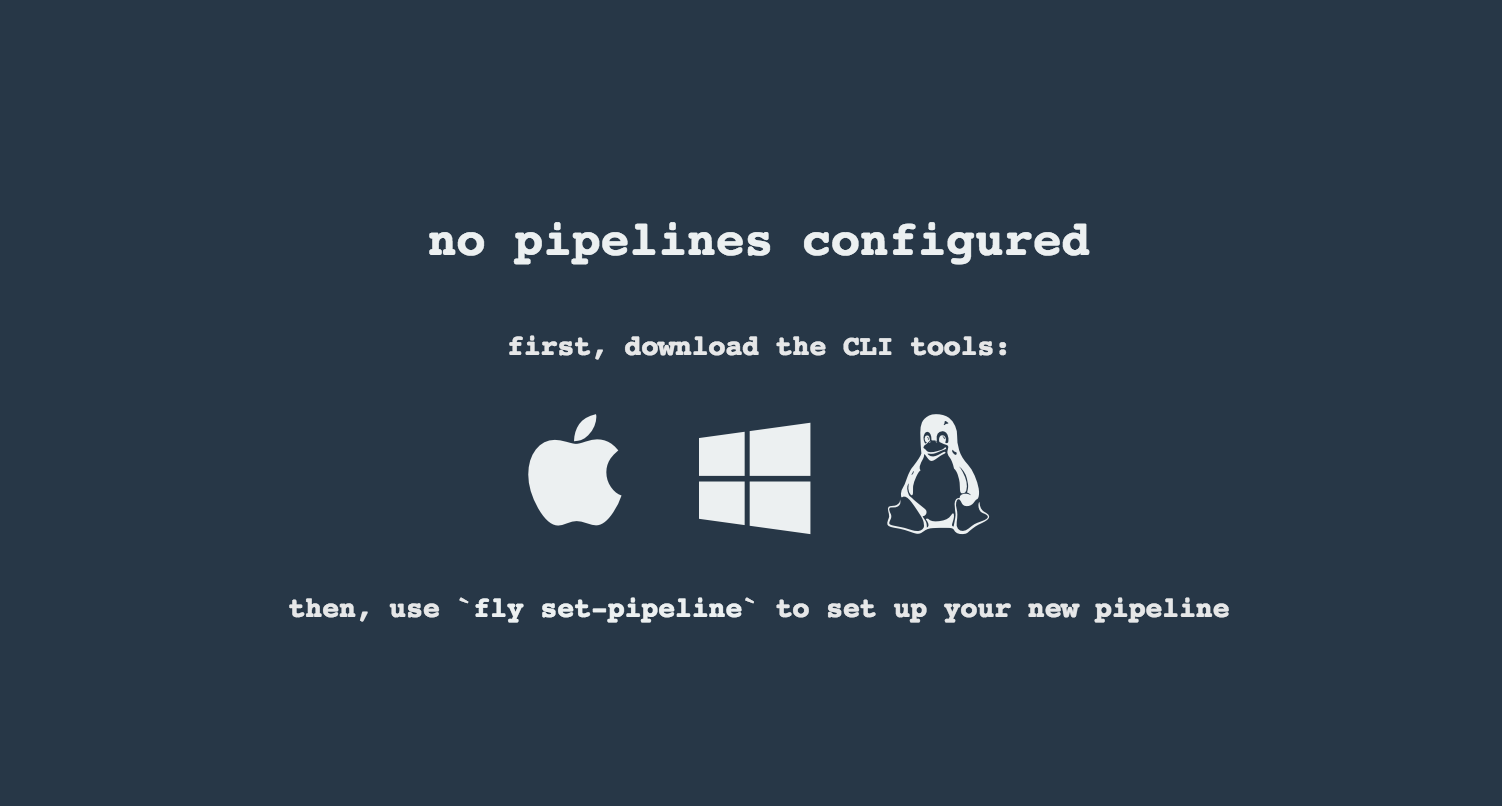
You can click one of the icons (depending on your OS) to download fly, which is the Concourse CLI. Once you’ve downloaded that (and maybe added to your PATH) you can run:
fly --version
If fly is properly installed then it should print out the version.
The repo comes with credentials-sample-cf.yml which is set up with sample data (most credentials) are set to be applicable for PCF Dev. Copy this file to a new file credentials.yml (the file is added to .gitignore so don’t worry that you’ll push it with your passwords) and edit it as you wish. For our demo just setup:
app-url- url pointing to your forkedgithub-webhookrepogithub-private-key- your private key to clone / tag GitHub reposrepo-with-binaries- the IP is set to the defaults for Docker Machine. You should update it to point to your setup
If you don’t have a Docker Machine just execute ./whats_my_ip.sh script to
get an external IP that you can pass to your repo-with-binaries instead of the default
Docker Machine IP.
Below you can see what environment variables are required by the scripts. To the right hand side you can see the default values for PCF Dev that we set in the credentials-sample-cf.yml.
| Property Name | Property Description | Default value |
|---|---|---|
BUILD_OPTIONS | Additional options you would like to pass to the Maven / Gradle build | |
PAAS_TEST_API_URL | The URL to the CF Api for TEST env | api.local.pcfdev.io |
PAAS_STAGE_API_URL | The URL to the CF Api for STAGE env | api.local.pcfdev.io |
PAAS_PROD_API_URL | The URL to the CF Api for PROD env | api.local.pcfdev.io |
PAAS_TEST_ORG | Name of the org for the test env | pcfdev-org |
PAAS_TEST_SPACE | Name of the space for the test env | pcfdev-space |
PAAS_STAGE_ORG | Name of the org for the stage env | pcfdev-org |
PAAS_STAGE_SPACE | Name of the space for the stage env | pcfdev-space |
PAAS_PROD_ORG | Name of the org for the prod env | pcfdev-org |
PAAS_PROD_SPACE | Name of the space for the prod env | pcfdev-space |
REPO_WITH_BINARIES | URL to repo with the deployed jars | |
M2_SETTINGS_REPO_ID | The id of server from Maven settings.xml | artifactory-local |
PAAS_HOSTNAME_UUID | Additional suffix for the route. In a shared environment the default routes can be already taken | |
APP_MEMORY_LIMIT | How much memory should be used by the infra apps (Eureka, Stub Runner etc.) | 256m |
JAVA_BUILDPACK_URL | The URL to the Java buildpack to be used by CF |
Log in (e.g. for Concourse running at 192.168.99.100 - if you don’t provide any value then localhost is assumed). If you execute this script (it assumes that either fly is on your PATH or it’s in the same folder as the script is):
./login.sh 192.168.99.100
Next run the command to create the pipeline.
./set_pipeline.sh
Then you’ll create a github-webhook pipeline under the docker alias, using the provided credentials.yml file.
You can override these values in exactly that order (e.g. ./set-pipeline.sh some-project another-target some-other-credentials.yml)

| Important |
|---|---|
In this chapter we assume that you perform deployment of your application to Kubernetes PaaS |
The Spring Cloud Pipelines repository contains opinionated Concourse pipeline definition. Those jobs will form an empty pipeline and a sample, opinionated one that you can use in your company.
All in all there are the following projects taking part in the whole microservice setup for this demo.
- Github Analytics - the app that has a REST endpoint and uses messaging. Our business application.
- Github Webhook - project that emits messages that are used by Github Analytics. Our business application.
- Eureka - simple Eureka Server. This is an infrastructure application.
- Github Analytics Stub Runner Boot - Stub Runner Boot server to be used for tests with Github Analytics. Uses Eureka and Messaging. This is an infrastructure application.
This is a guide for Concourse pipeline.
If you want to just run the demo as far as possible using PCF Dev and Docker Compose
The simplest way to deploy Concourse to K8S is to use Helm.
Once you have Helm installed and your kubectl is pointing to the
cluster, just type this command to install the Concourse cluster in your K8S cluster.
$ helm install stable/concourse --name concourse
Once it’s done you’ll see the following output
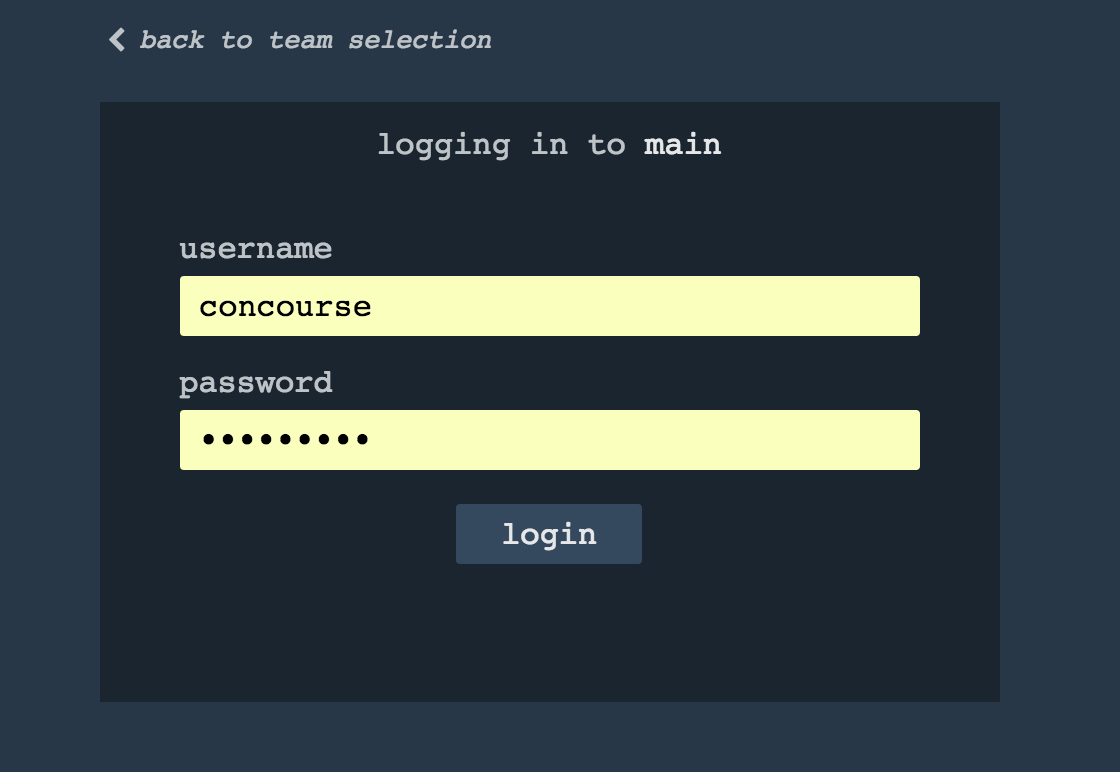
1. Concourse can be accessed:

  * Within your cluster, at the following DNS name at port 8080:

    concourse-web.default.svc.cluster.local

  * From outside the cluster, run these commands in the same shell:

    export POD_NAME=$(kubectl get pods --namespace default -l "app=concourse-web" -o jsonpath="{.items[0].metadata.name}")
    echo "Visit http://127.0.0.1:8080 to use Concourse"
    kubectl port-forward --namespace default $POD_NAME 8080:8080

2. Login with the following credentials

  Username: concourse
  Password: concourse
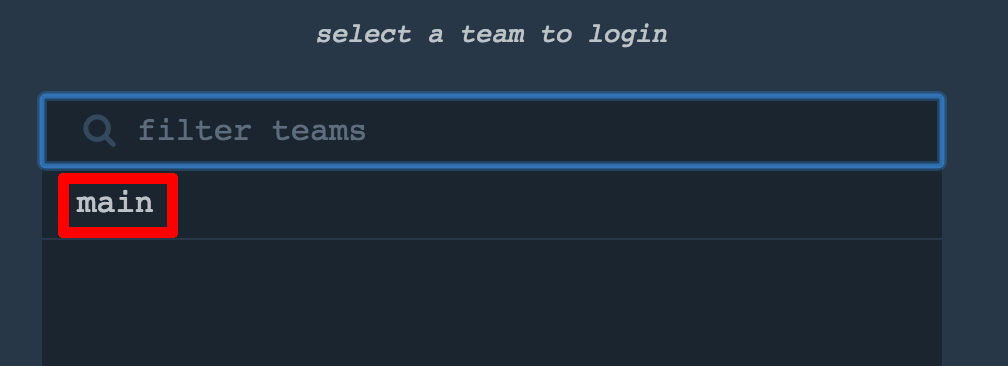
Just follow these steps and log in to Concourse under http://127.0.0.1:8080.
We can use Helm also to deploy Artifactory to K8S
$ helm install --name artifactory --set artifactory.image.repository=docker.bintray.io/jfrog/artifactory-oss stable/artifactoryAfter executing this you’ll see the following output
NOTES:
Congratulations. You have just deployed JFrog Artifactory Pro!

1. Get the Artifactory URL by running these commands:

   NOTE: It may take a few minutes for the LoadBalancer IP to be available.
         You can watch the status of the service by running 'kubectl get svc -w nginx'
   export SERVICE_IP=$(kubectl get svc --namespace default nginx -o jsonpath='{.status.loadBalancer.ingress[0].ip}')
   echo http://$SERVICE_IP/

2. Open Artifactory in your browser
   Default credential for Artifactory:
   user: admin
   password: password
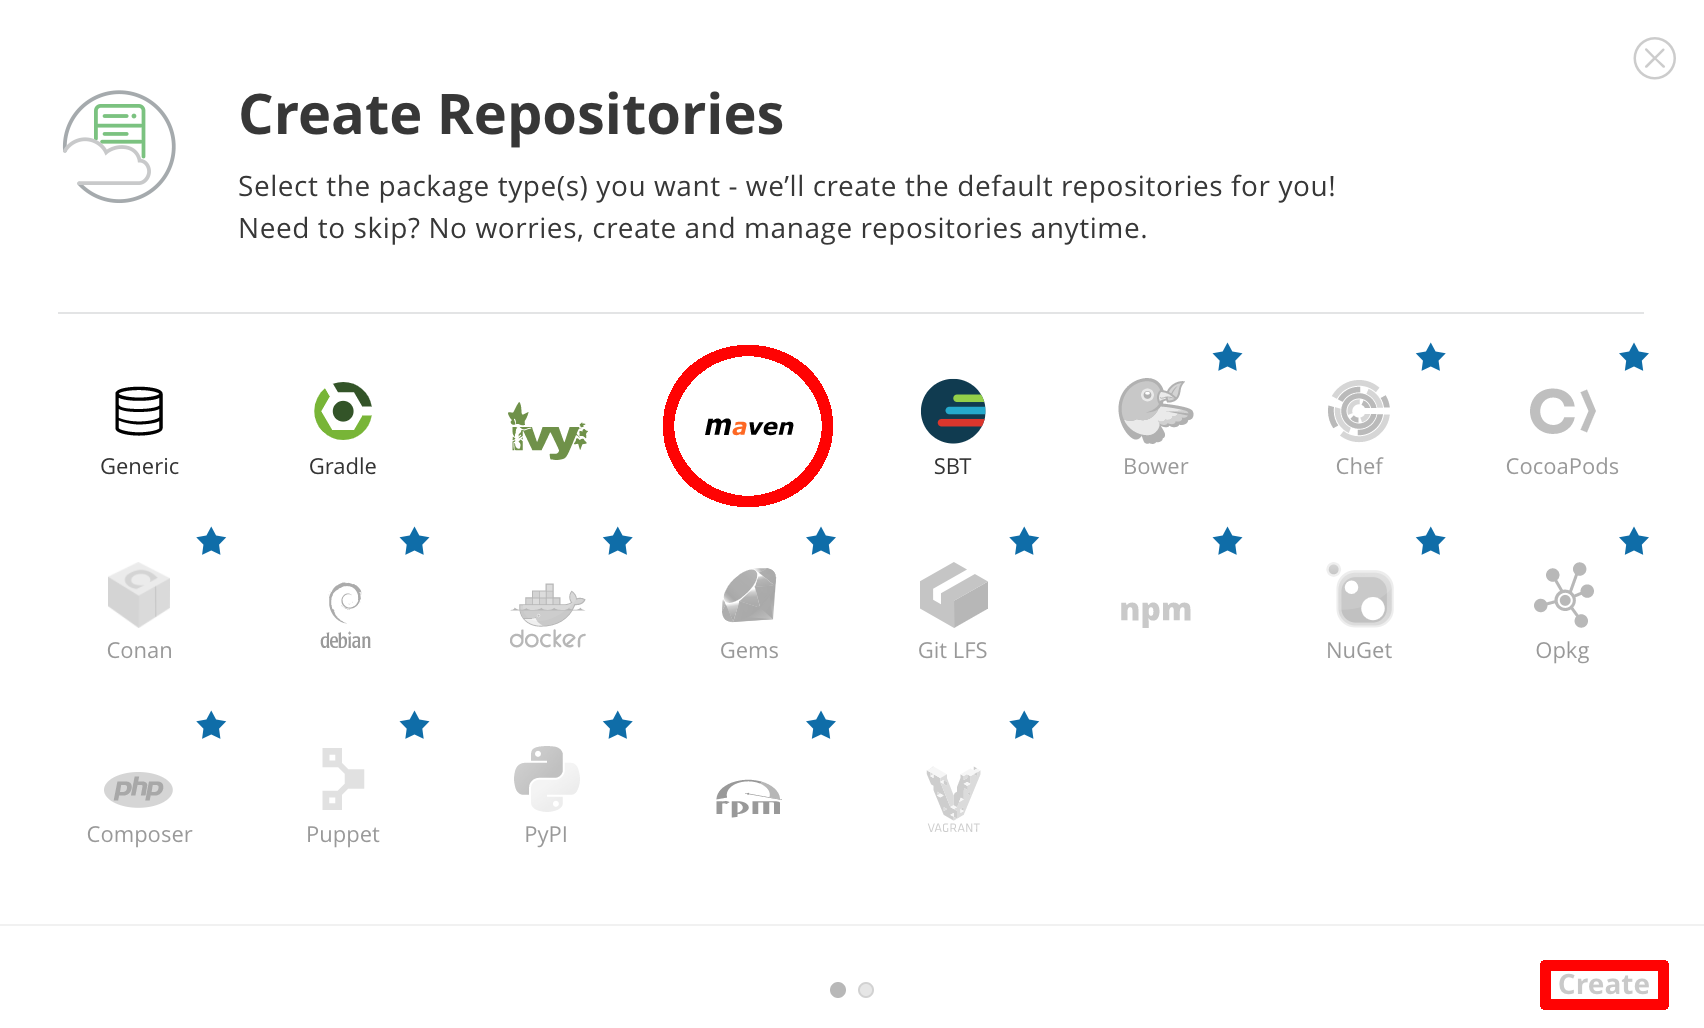
Next, we need to set up the repositories.
First, access the Artifactory URL and log in with
user, admin and password password.
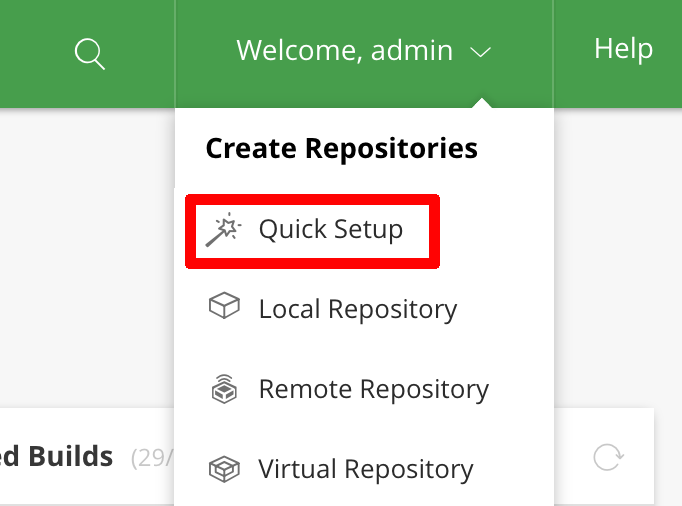
Then, click on the Maven setup and click Create.
If you go to Concourse website you should see sth like this:
You can click one of the icons (depending on your OS) to download fly, which is the Concourse CLI. Once you’ve downloaded that (and maybe added to your PATH) you can run:
fly --version
If fly is properly installed then it should print out the version.
There is a sample credentials file called credentials-sample-k8s.yml
prepared for k8s. You can use it as a base for your credentials.yml.
To allow the Concourse worker’s spawned container to connect to Kubernetes cluster you will need to pass the CA contents and the auth token.
To get the contents of CA for GCE just execute
$ kubectl get secret $(kubectl get secret | grep default-token | awk '{print $1}') -o jsonpath='{.data.ca\.crt}' | base64 --decode
To get the token just type:
$ kubectl get secret $(kubectl get secret | grep default-token | awk '{print $1}') -o jsonpath='{.data.token}' | base64 --decode
Set that value under paas-test-client-token, paas-stage-client-token and paas-prod-client-token
After running Concourse you should get the following output in your terminal
$ export POD_NAME=$(kubectl get pods --namespace default -l "app=concourse-web" -o jsonpath="{.items[0].metadata.name}")
$ echo "Visit http://127.0.0.1:8080 to use Concourse"
$ kubectl port-forward --namespace default $POD_NAME 8080:8080
Visit http://127.0.0.1:8080 to use Concourse
Log in (e.g. for Concourse running at 127.0.0.1 - if you don’t provide any value then localhost is assumed). If you execute this script (it assumes that either fly is on your PATH or it’s in the same folder as the script is):
$ fly -t k8s login -c http://localhost:8080 -u concourse -p concourseNext run the command to create the pipeline.
$ ./set_pipeline.sh github-webhook k8s credentials-k8s.yml
Not really. This is an opinionated pipeline that’s why we took some
opinionated decisions. Check out the documentation to see
what those decisions are.
Sure! It’s open-source! The important thing is that the core part of the logic is written in Bash scripts. That way, in the majority of cases, you could change only the bash scripts without changing the whole pipeline. You can check out the scripts here.
Furthermore, if you only want to customize a particular function under common/src/main/bash, you can provide your own
function under common/src/main/bash/<some custom identifier> where <some custom identifier> is equal to the value of
the CUSTOM_SCRIPT_IDENTIFIER environment variable. It defaults to custom.
When deploying the app to stage or prod you can get an exception Insufficient resources. The way to
solve it is to kill some apps from test / stage env. To achieve that just call
cf target -o pcfdev-org -s pcfdev-test
cf stop github-webhook
cf stop github-eureka
cf stop stubrunner
You can also execute ./tools/cf-helper.sh kill-all-apps that will remove
all demo-related apps deployed to PCF Dev.
You must have pushed some tags and have removed the Artifactory volume that contained them. To fix this, just remove the tags
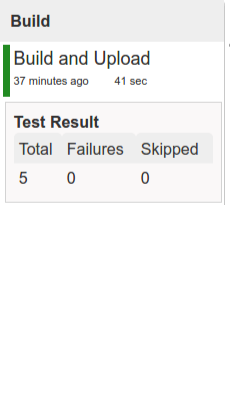
git tag -l | xargs -n 1 git push --delete originYes! Assuming that pipeline name is github-webhook and job name is build-and-upload you can running
fly watch --job github-webhook/build-and-upload -t docker
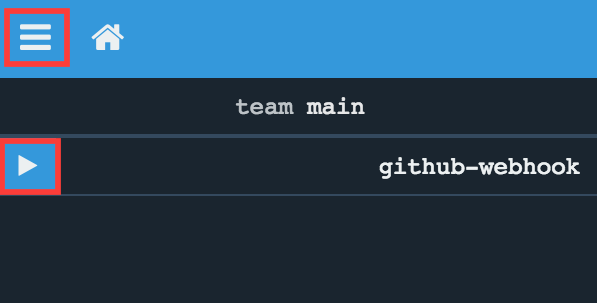
Don’t worry… most likely you’ve just forgotten to click the play button to
unpause the pipeline. Click to the top left, expand the list of pipelines and click
the play button next to github-webhook.
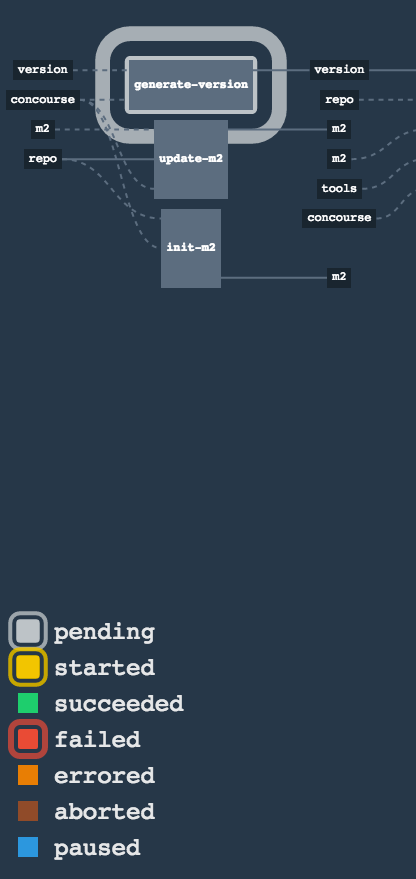
Another problem that might occur is that you need to have the version branch.
Concourse will wait for the version branch to appear in your repo. So in order for
the pipeline to start ensure that when doing some git operations you haven’t
forgotten to create / copy the version branch too.
If you play around with Jenkins / Concourse you might end up with the routes occupied
Using route github-webhook-test.local.pcfdev.io
Binding github-webhook-test.local.pcfdev.io to github-webhook...
FAILED
The route github-webhook-test.local.pcfdev.io is already in use.
Just delete the routes
yes | cf delete-route local.pcfdev.io -n github-webhook-test
yes | cf delete-route local.pcfdev.io -n github-eureka-test
yes | cf delete-route local.pcfdev.io -n stubrunner-test
yes | cf delete-route local.pcfdev.io -n github-webhook-stage
yes | cf delete-route local.pcfdev.io -n github-eureka-stage
yes | cf delete-route local.pcfdev.io -n github-webhook-prod
yes | cf delete-route local.pcfdev.io -n github-eureka-prod
You can also execute the ./tools/cf-helper.sh delete-routes
Most likely you’ve forgotten to update your local settings.xml with the Artifactory’s
setup. Check out this section of the docs and update your settings.xml.
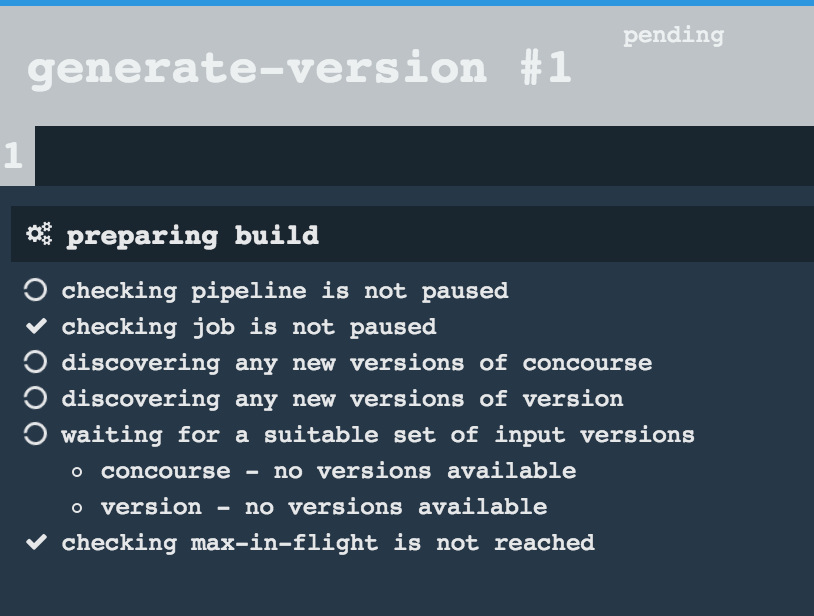
When I click on it it looks like this:
resource script '/opt/resource/check []' failed: exit status 128

stderr:
Identity added: /tmp/git-resource-private-key (/tmp/git-resource-private-key)
Cloning into '/tmp/git-resource-repo-cache'...
warning: Could not find remote branch version to clone.
fatal: Remote branch version not found in upstream origin
That means that your repo doesn’t have the version branch. Please
set it up.
In this section we will present the common setup of Jenkins for any platform. We will also provide answers to most frequently asked questions.
.
├── declarative-pipeline
│   └── Jenkinsfile-sample.groovy
├── jobs
│   ├── jenkins_pipeline_empty.groovy
│   ├── jenkins_pipeline_jenkinsfile_empty.groovy
│   ├── jenkins_pipeline_sample.groovy
│   └── jenkins_pipeline_sample_view.groovy
├── seed
│   ├── init.groovy
│   ├── jenkins_pipeline.groovy
│   ├── k8s
│   └── settings.xml
└── src
    ├── main
    └── test
In the declarative-pipeline you can find a definition of a Jenkinsfile-sample.groovy declarative
pipeline. It’s used together with the Blueocean UI.
In the jobs folder you have all the seed jobs that will generate pipelines.
jenkins_pipeline_empty.groovy- is a template of a pipeline with empty steps using the Jenkins Job DSL pluginjenkins_pipeline_jenkinsfile_empty.groovy- is a template of a pipeline with empty steps using the Pipeline pluginjenkins_pipeline_sample.groovy- is an opinionated implementation using the Jenkins Job DSL pluginjenkins_pipeline_sample_view.groovy- builds the views for the pipelines
In the seed folder you have the init.groovy file which is executed when Jenkins starts.
That way we can configure most of Jenkins options for you (adding credentials, JDK etc.).
jenkins_pipeline.groovy contains logic to build a seed job (that way you don’t have to even click that
job - we generate it for you). Under the k8s folder there are all the configuration
files required for deployment to a Kubernetes cluster.
In the src folder you have production and test classes needed for you to build your own pipeline.
Currently we have tests only cause the whole logic resides in the jenkins_pipeline_sample file.
All the steps below are not necessary to run the demo. They are needed only when you want to do some custom changes.
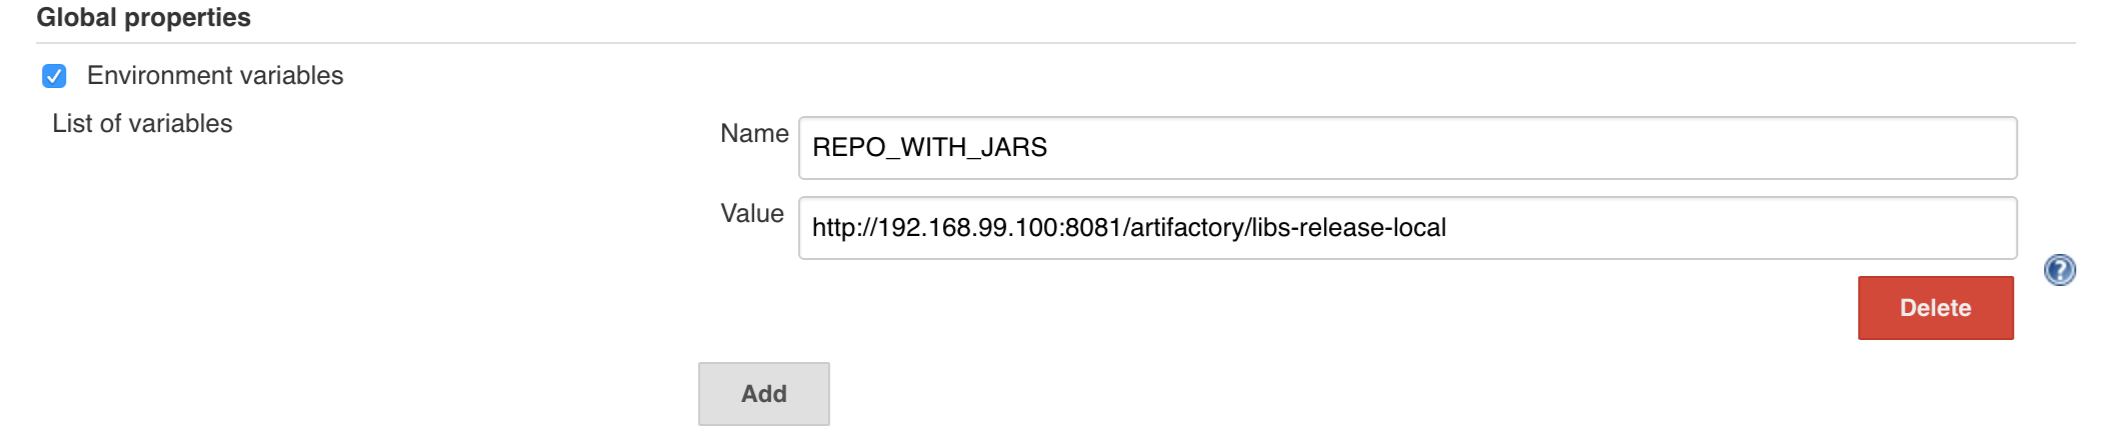
It’s enough to set the ARTIFACTORY_URL environmental variable before
executing tools/deploy-infra.sh. Example for deploying to Artifactory at IP 192.168.99.100
git clone https://github.com/spring-cloud/spring-cloud-pipelines
cd spring-cloud-pipelines/
ARTIFACTORY_URL="http://192.168.99.100:8081/artifactory/libs-release-local" ./tools/deploy-infra.sh
| Tip |
|---|---|
If you want to use the default connection to the Docker version of Artifactory you can skip this step |
So that ./mvnw deploy works with Artifactory from Docker we’re
already copying the missing settings.xml file for you. It looks more or less like this:
<?xml version="1.0" encoding="UTF-8"?>
<settings>
	<servers>
		<server>
			<id>${M2_SETTINGS_REPO_ID}</id>
			<username>${M2_SETTINGS_REPO_USERNAME}</username>
			<password>${M2_SETTINGS_REPO_PASSWORD}</password>
		</server>
		<server>
			<id>${DOCKER_SERVER_ID}</id>
			<username>${DOCKER_USERNAME}</username>
			<password>${DOCKER_PASSWORD}</password>
			<configuration>
				<email>${DOCKER_EMAIL}</email>
			</configuration>
		</server>
	</servers>
</settings>
As you can see the file is parameterized. In Maven it’s enough to pass
to ./mvnw command the proper system property to override that value. For example to pass
a different docker email you’d have to call ./mvnw -DDOCKER_EMAIL=[email protected] and the value
gets updated.
If you want to use your own version of Artifactory / Nexus you have to update
the file (it’s in seed/settings.xml).
If you want to only play around with the demo that we’ve prepared you have to set ONE variable which is the REPOS variable.
That variable needs to consists of comma separated list of URLs to repositories containing business apps. So you should pass your forked repos URLs.
You can do it in the following ways:
- globally via Jenkins global env vars (then when you run the seed that variable will be taken into consideration and proper pipelines will get built)
- modify the seed job parameters (you’ll have to modify the seed job configuration and change the
REPOSproperty) - provide the repos parameter when running the seed job
For the sake of simplicity let’s go with the last option.
| Important |
|---|---|
If you’re choosing the global envs, you HAVE to remove the other approach
(e.g. if you set the global env for |
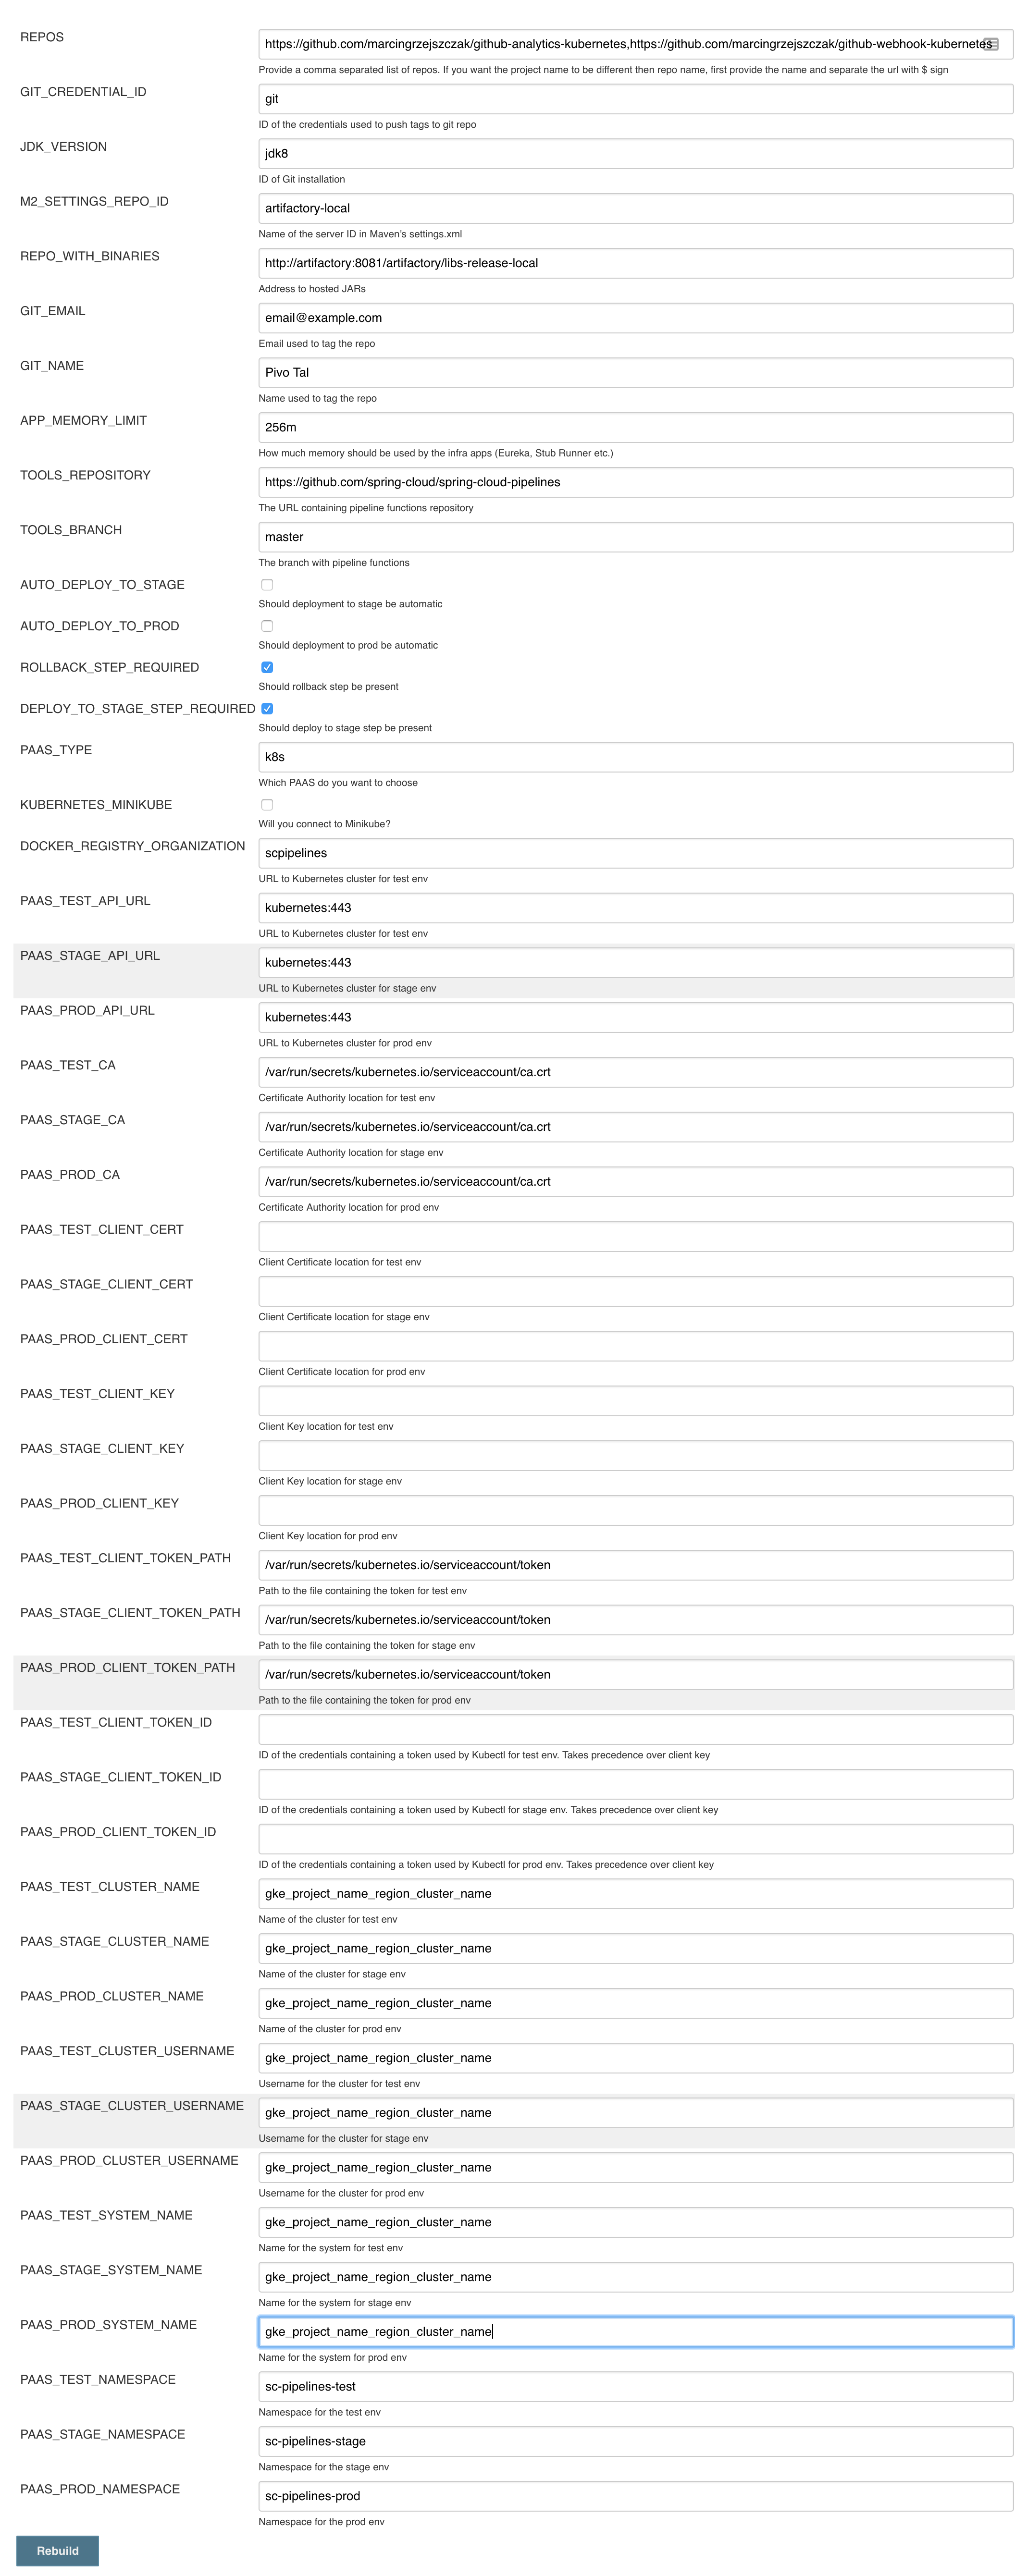
Click on the seed job and pick Build with parameters. Then as presented in the screen below (you’ll have far more properties to set) just modify the REPOS property by providing the comma separated list of URLs to your forks. Whatever you set will be parsed by the seed job and passed to the generated Jenkins jobs.
| Tip |
|---|---|
This is very useful when the repos you want to build differ. E.g. use
different JDK. Then some seeds can set the |
Example screen:
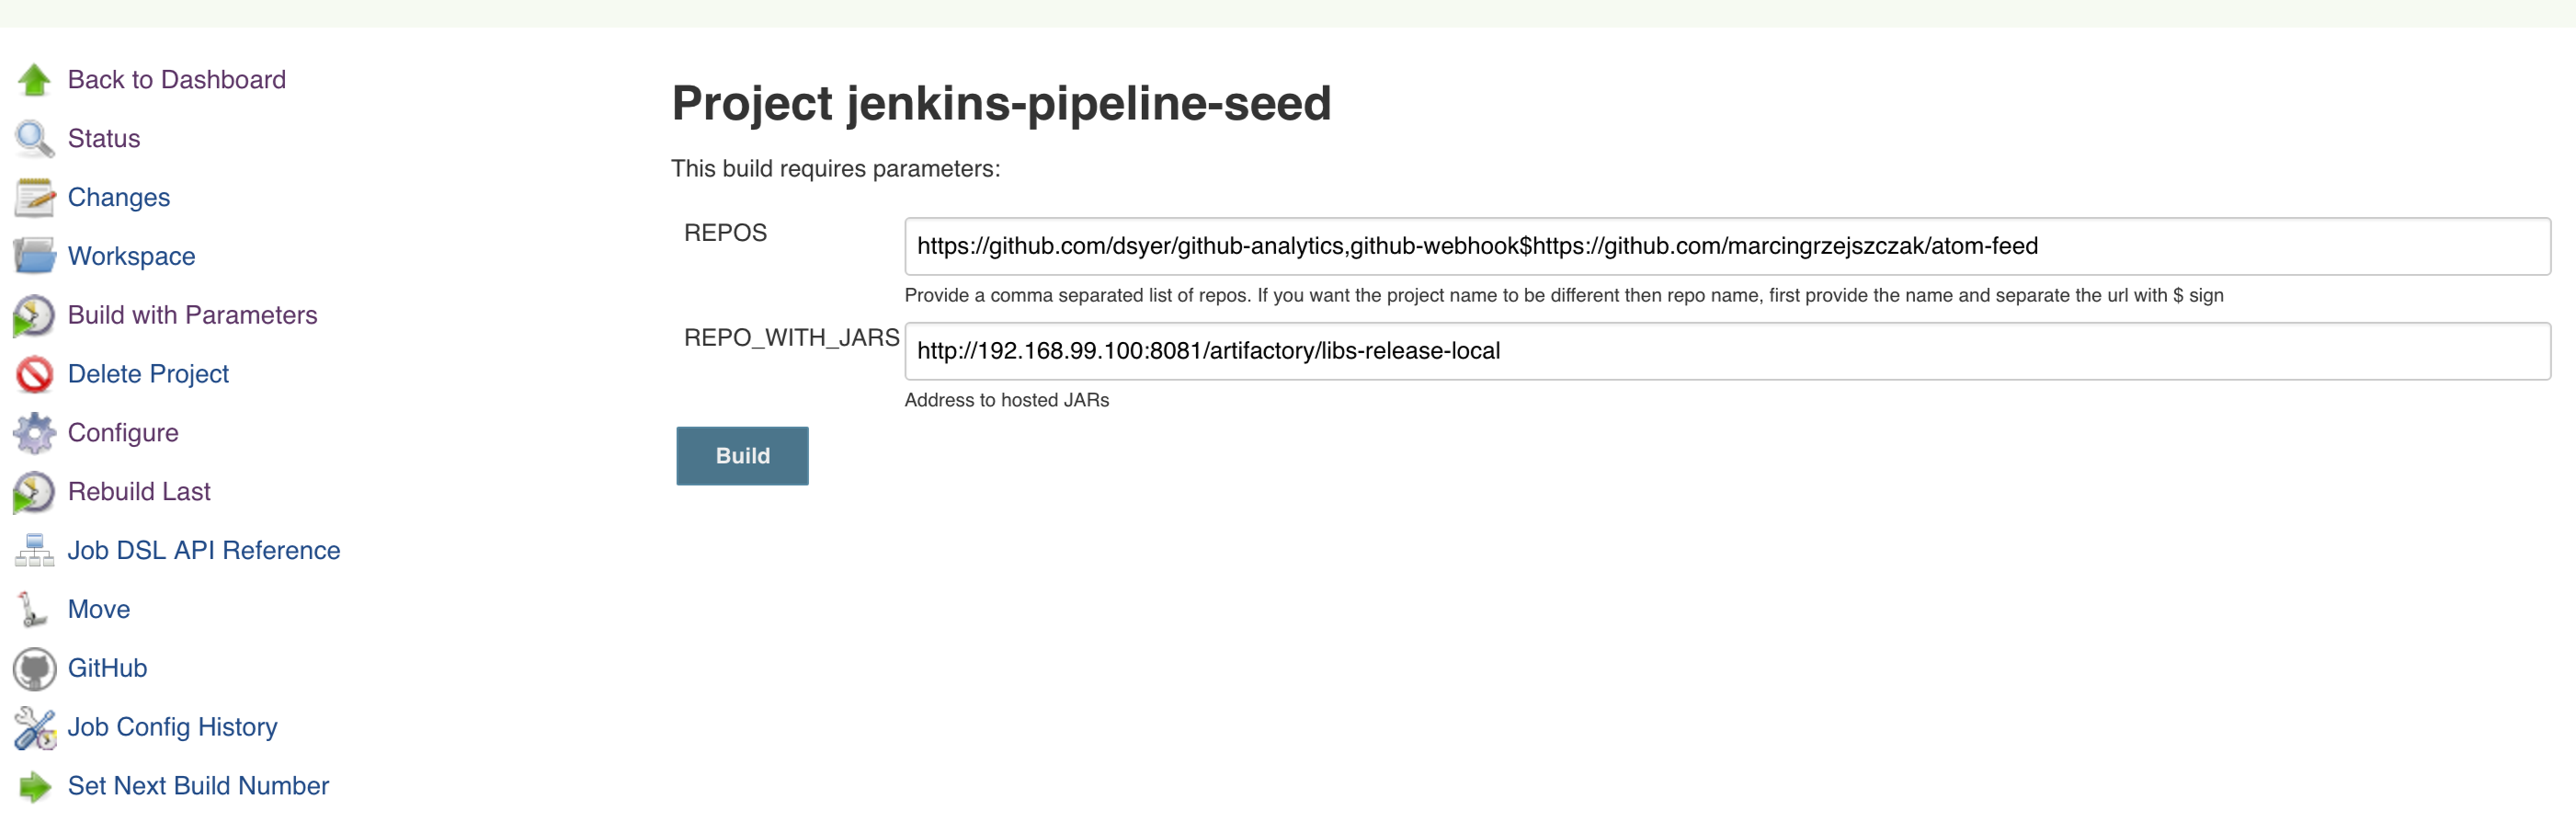
In the screenshot we could parametrize the REPOS and REPO_WITH_BINARIES params.
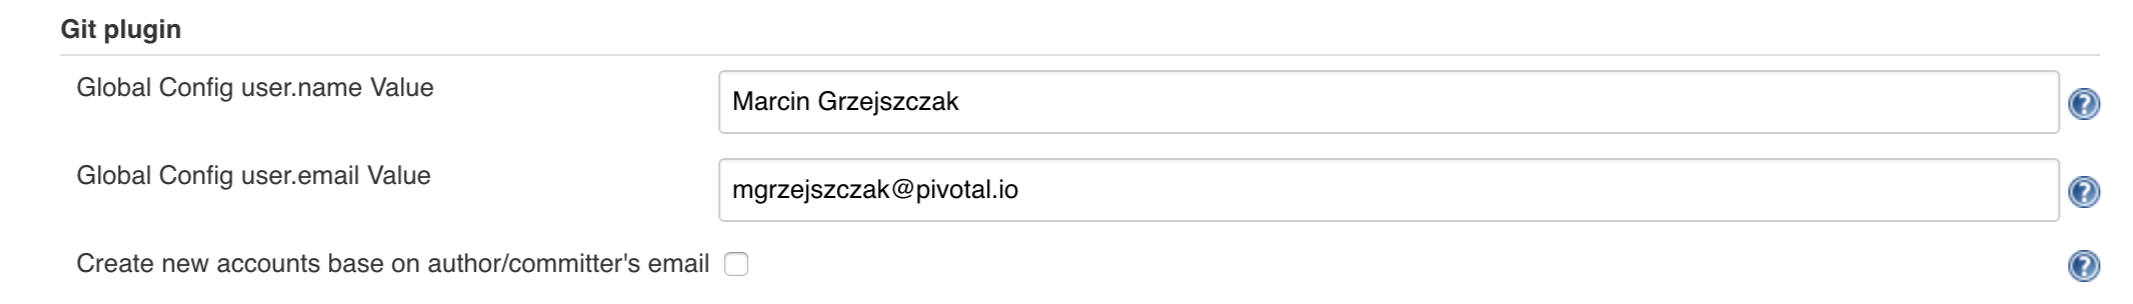
Since our pipeline is setting the git user / name explicitly for the build step
you’d have to go to Configure of the build step and modify the Git name / email.
If you want to set it globally you’ll have to remove the section from the build
step and follow these steps to set it globally.
You can set Git email / user globally like this:
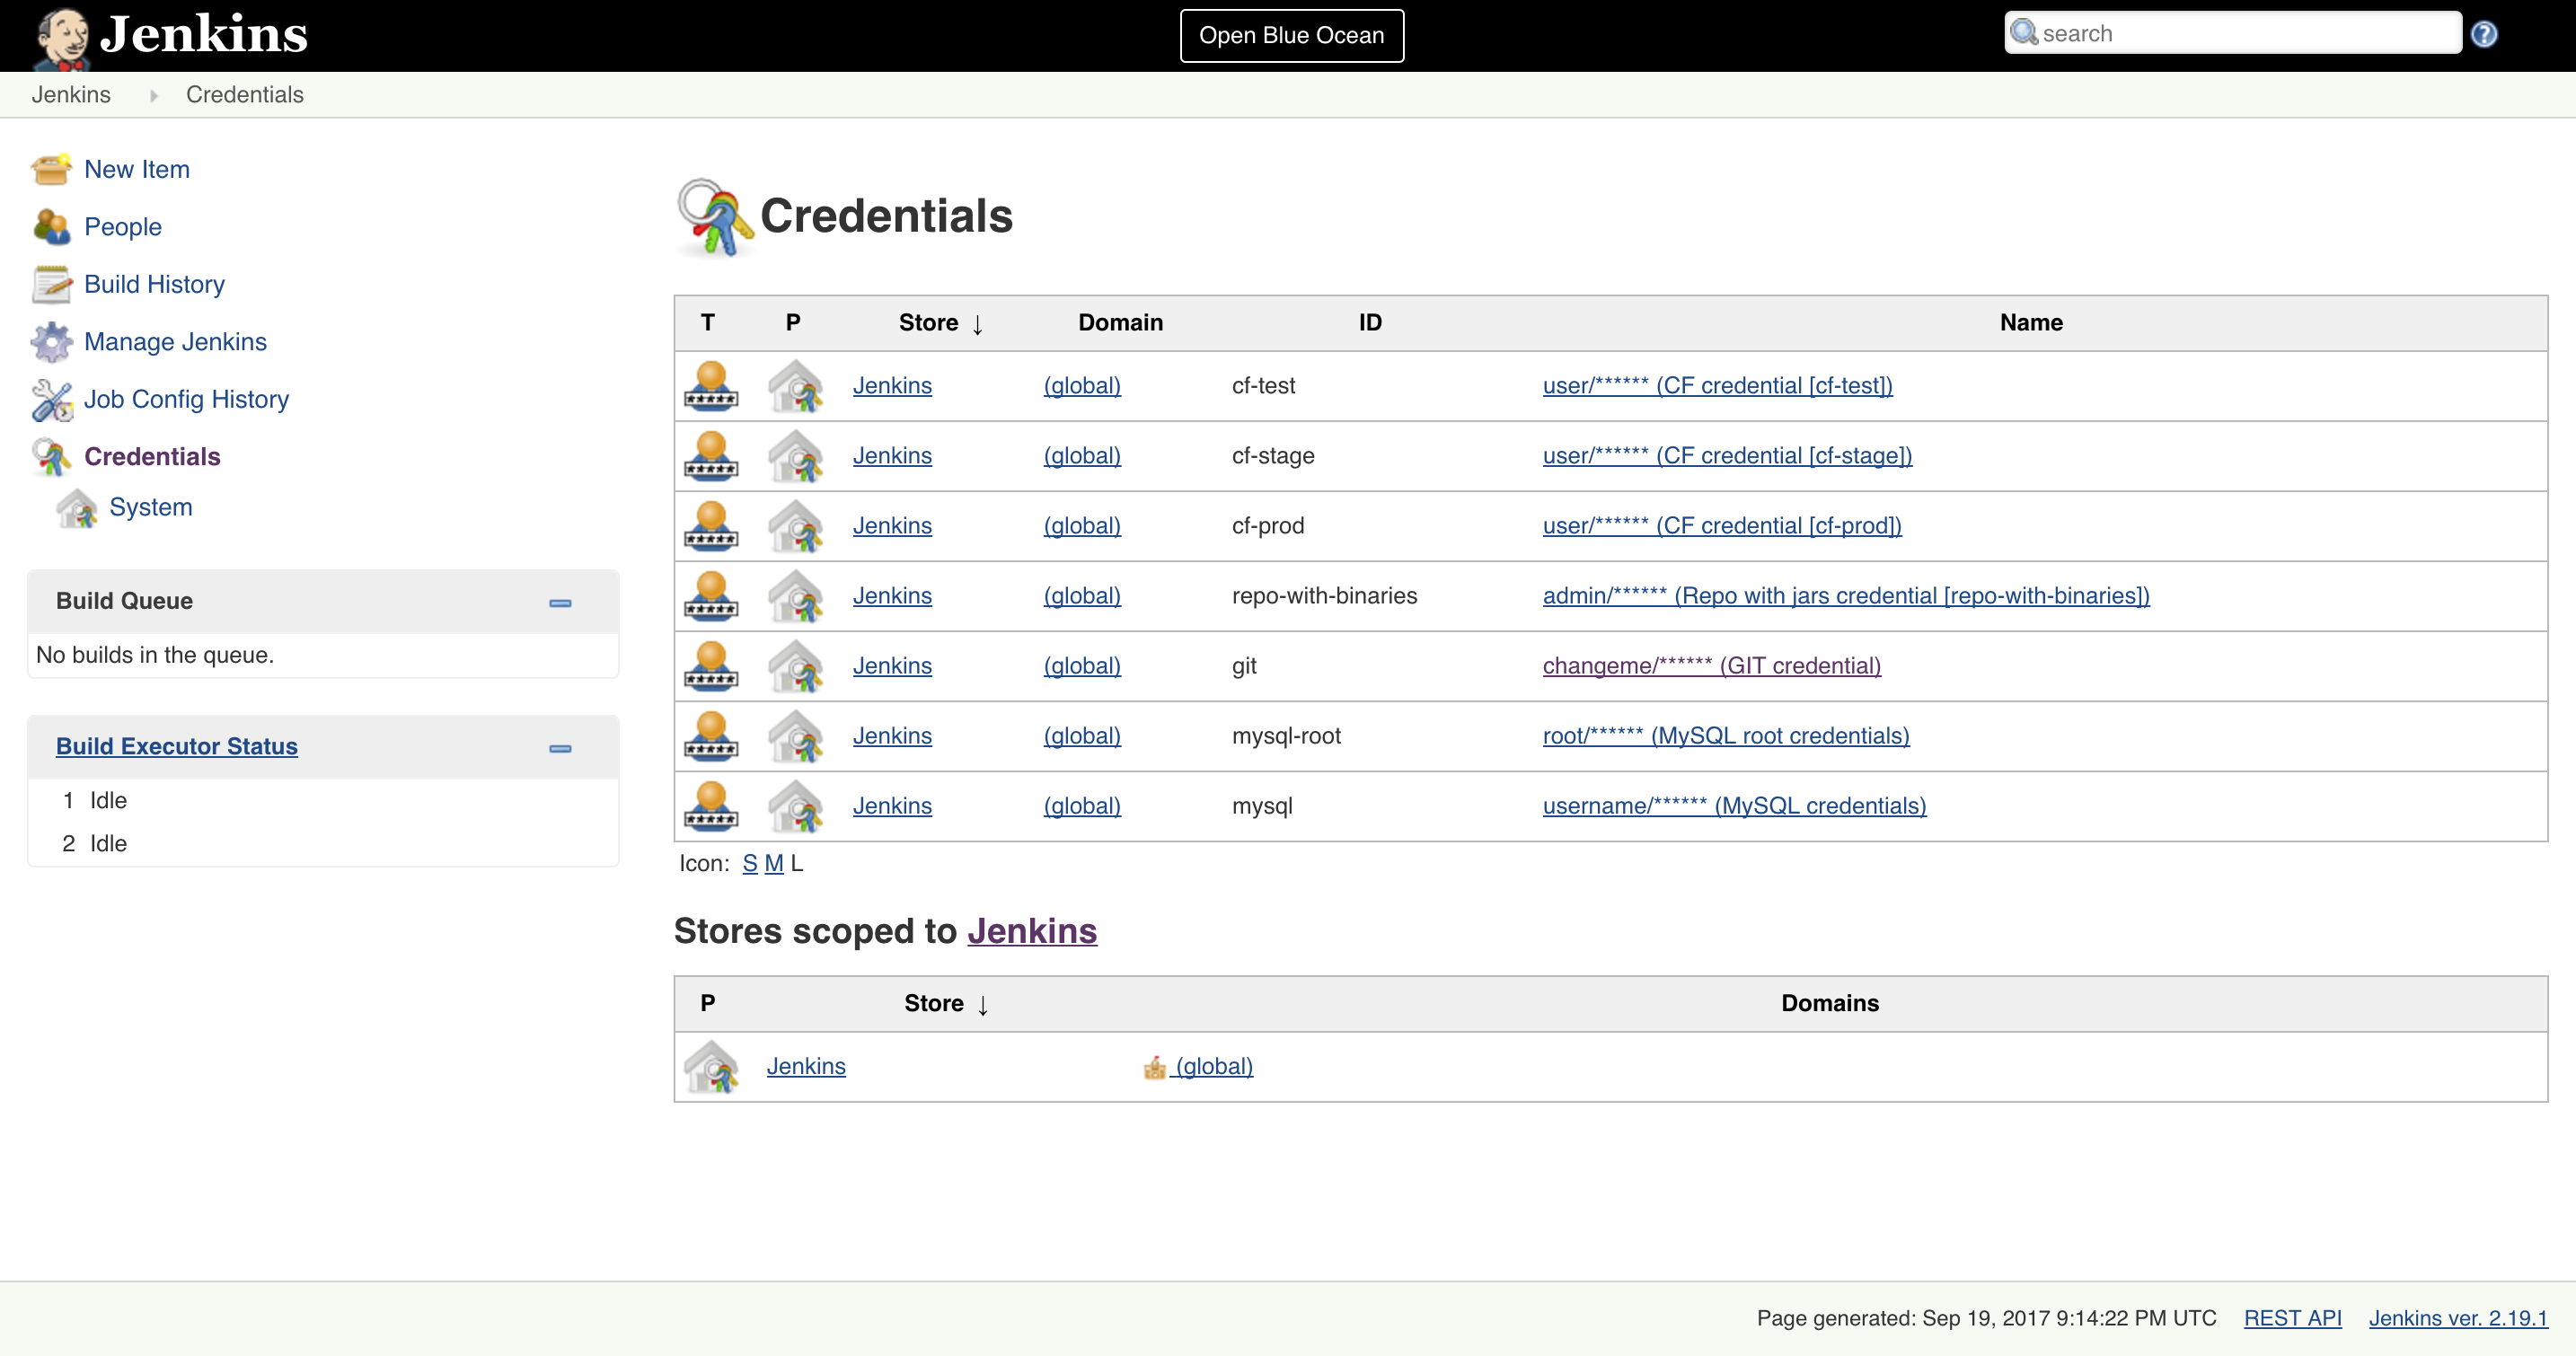
The scripts will need to access the credential in order to tag the repo.
You have to set credentials with id: git.
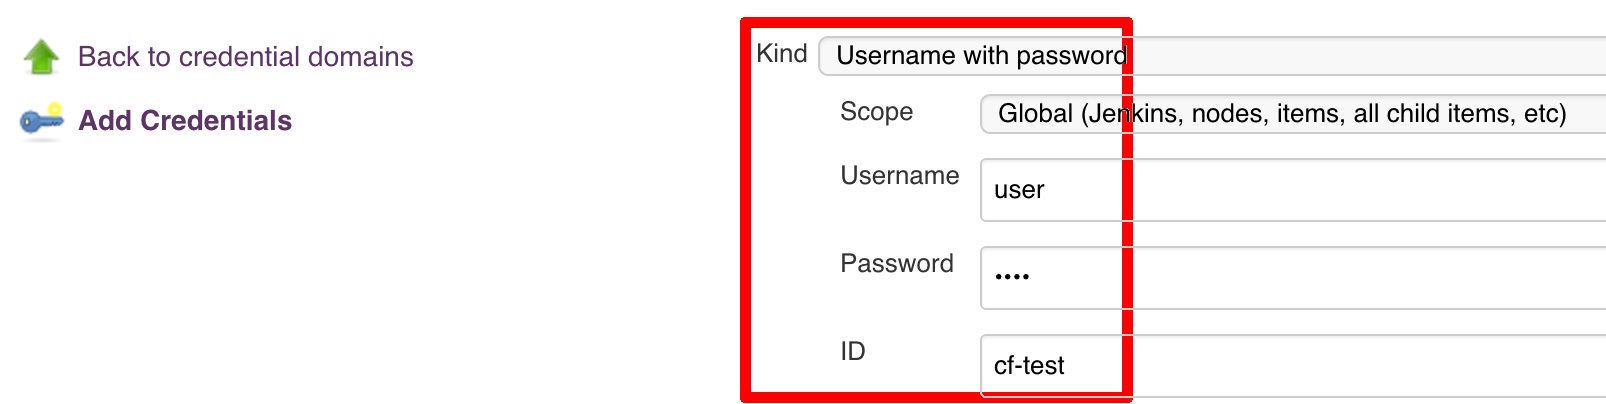
Below you can find instructions on how to set a credential (e.g. for Cloud Foundry cf-test credential but
remember to provide the one with id git).

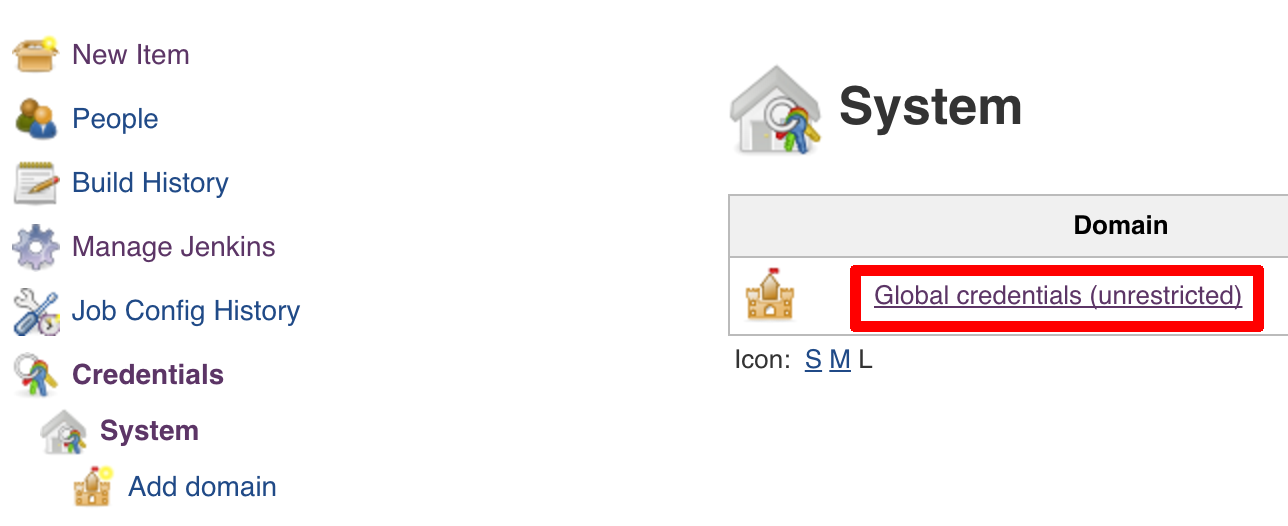
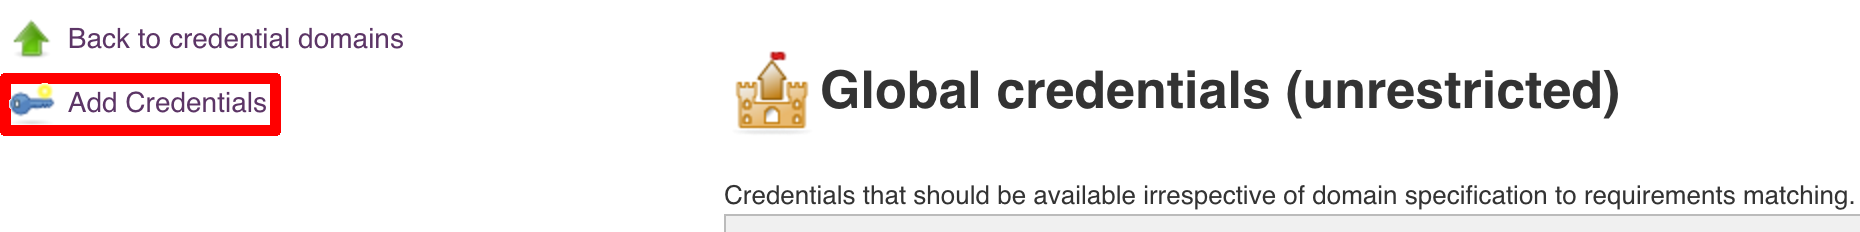
Figure 7.7. Fill out the user / password and provide the git credential ID (in this example cf-test)
./gradlew clean build
| Warning |
|---|---|
The ran test only checks if your scripts compile. |
Check out the tutorial. Provide the link to this repository in your Jenkins installation.
| Warning |
|---|---|
Remember that views can be overridden that’s why the suggestion is to contain in one script all the logic needed to build a view
for a single project (check out that |
If you would like to run the pre-configured Jenkins image somewhere other than your local machine, we
have an image you can pull and use on DockerHub.
The latest tag corresponds to the latest snapshot build. You can also find tags
corresponding to stable releases that you can use as well.
| Important |
|---|---|
In this chapter we assume that you perform deployment of your application to Cloud Foundry PaaS |
The Spring Cloud Pipelines repository contains job definitions and the opinionated setup pipeline using Jenkins Job DSL plugin. Those jobs will form an empty pipeline and a sample, opinionated one that you can use in your company.
All in all there are the following projects taking part in the whole microservice setup for this demo.
- Github Analytics - the app that has a REST endpoint and uses messaging. Our business application.
- Github Webhook - project that emits messages that are used by Github Analytics. Our business application.
- Eureka - simple Eureka Server. This is an infrastructure application.
- Github Analytics Stub Runner Boot - Stub Runner Boot server to be used for tests with Github Analytics. Uses Eureka and Messaging. This is an infrastructure application.
This is a guide for Jenkins Job DSL based pipeline.
If you want to just run the demo as far as possible using PCF Dev and Docker Compose
There are 4 apps that are composing the pipeline
You need to fork only these. That’s because only then will your user be able to tag and push the tag to repo.
Jenkins + Artifactory can be ran locally. To do that just execute the
start.sh script from this repo.
git clone https://github.com/spring-cloud/spring-cloud-pipelines
cd spring-cloud-pipelines/jenkins
./start.sh yourGitUsername yourGitPassword yourForkedGithubOrg
Then Jenkins will be running on port 8080 and Artifactory 8081.
The provided parameters will be passed as env variables to Jenkins VM
and credentials will be set in your set. That way you don’t have to do
any manual work on the Jenkins side. In the above parameters, the third parameter
could be yourForkedGithubOrg or yourGithubUsername. Also the REPOS env variable will
contain your GitHub org in which you have the forked repos.
When Artifactory is running, just execute the tools/deploy-infra.sh script from this repo.
git clone https://github.com/spring-cloud/spring-cloud-pipelines
cd spring-cloud-pipelines/
./tools/deploy-infra.sh
As a result both eureka and stub runner repos will be cloned, built
and uploaded to Artifactory.
| Tip |
|---|---|
You can skip this step if you have CF installed and don’t want to use PCF Dev The only thing you have to do is to set up spaces. |
| Warning |
|---|---|
It’s more than likely that you’ll run out of resources when you reach stage step. Don’t worry! Keep calm and clear some apps from PCF Dev and continue. |
You have to download and start PCF Dev. A link how to do it is available here.
The default credentials when using PCF Dev are:
username: user
password: pass
email: user
org: pcfdev-org
space: pcfdev-space
api: api.local.pcfdev.io
You can start the PCF Dev like this:
cf dev start
You’ll have to create 3 separate spaces (email admin, pass admin)
cf login -a https://api.local.pcfdev.io --skip-ssl-validation -u admin -p admin -o pcfdev-org

cf create-space pcfdev-test
cf set-space-role user pcfdev-org pcfdev-test SpaceDeveloper
cf create-space pcfdev-stage
cf set-space-role user pcfdev-org pcfdev-stage SpaceDeveloper
cf create-space pcfdev-prod
cf set-space-role user pcfdev-org pcfdev-prod SpaceDeveloper
You can also execute the ./tools/cf-helper.sh setup-spaces to do this.
We already create the seed job for you but you’ll have to run it. When you do run it you have to provide some properties. By default we create a seed that has all the properties options, but you can delete most of it. If you set the properties as global env variables you have to remove them from the seed.
Anyways, to run the demo just provide in the REPOS var the comma separated
list of URLs of the 2 aforementioned forks of github-webhook and `github-analytics'.
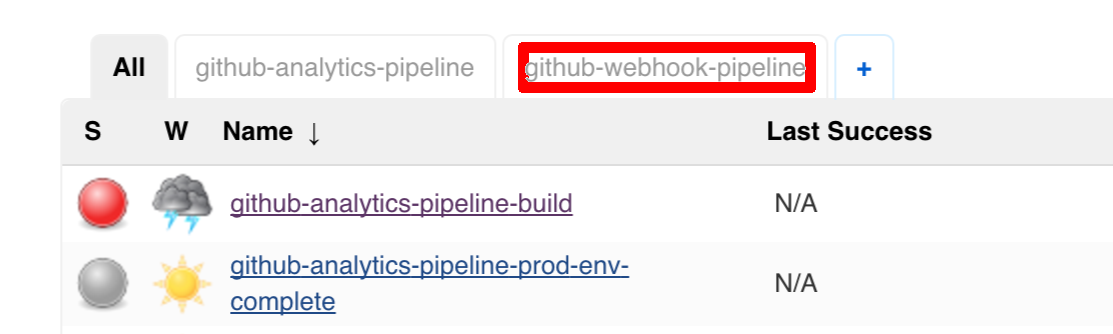
Figure 8.1. Click the 'jenkins-pipeline-seed-cf' job for Cloud Foundry and jenkins-pipeline-seed-k8s for Kubernetes

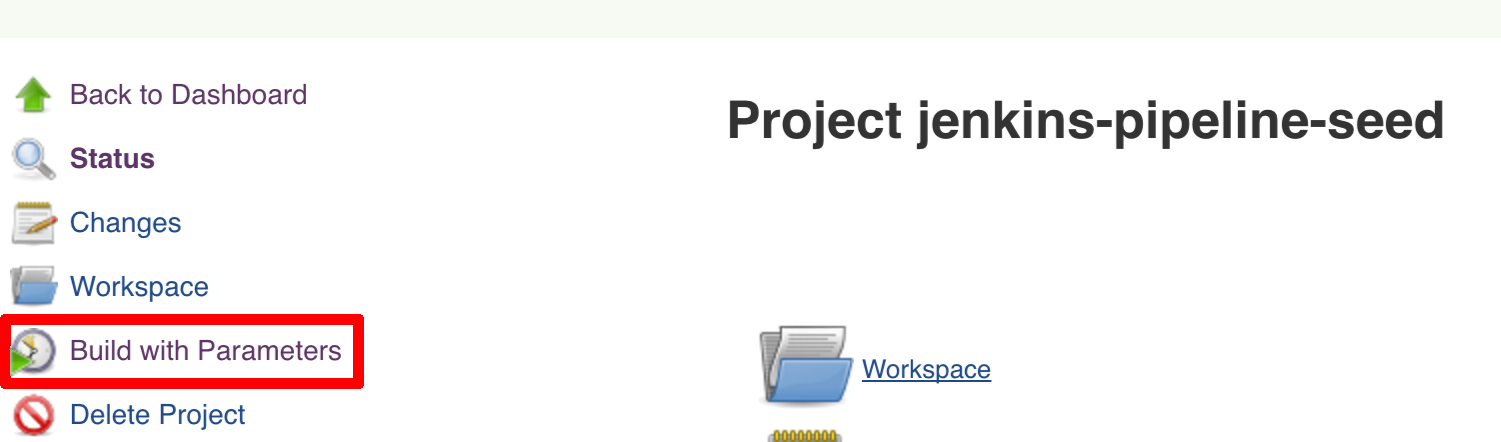
Figure 8.3. The REPOS parameter should already contain your forked repos (you’ll have more properties than the ones in the screenshot)
We already create the seed job for you but you’ll have to run it. When you do run it you have to provide some properties. By default we create a seed that has all the properties options, but you can delete most of it. If you set the properties as global env variables you have to remove them from the seed.
Anyways, to run the demo just provide in the REPOS var the comma separated
list of URLs of the 2 aforementioned forks of github-webhook and github-analytics.
| Important |
|---|---|
If your build fails on the deploy previous version to stage due to missing jar, that means that you’ve forgotten to clear the tags in your repo. Typically that’s due to the fact that you’ve removed the Artifactory volume with deployed JAR whereas a tag in the repo is still pointing there. Check out this section on how to remove the tag. |
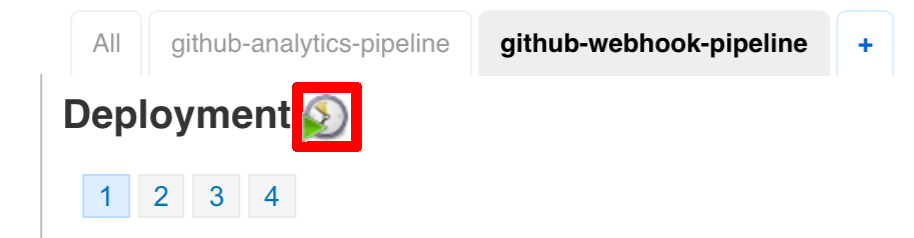
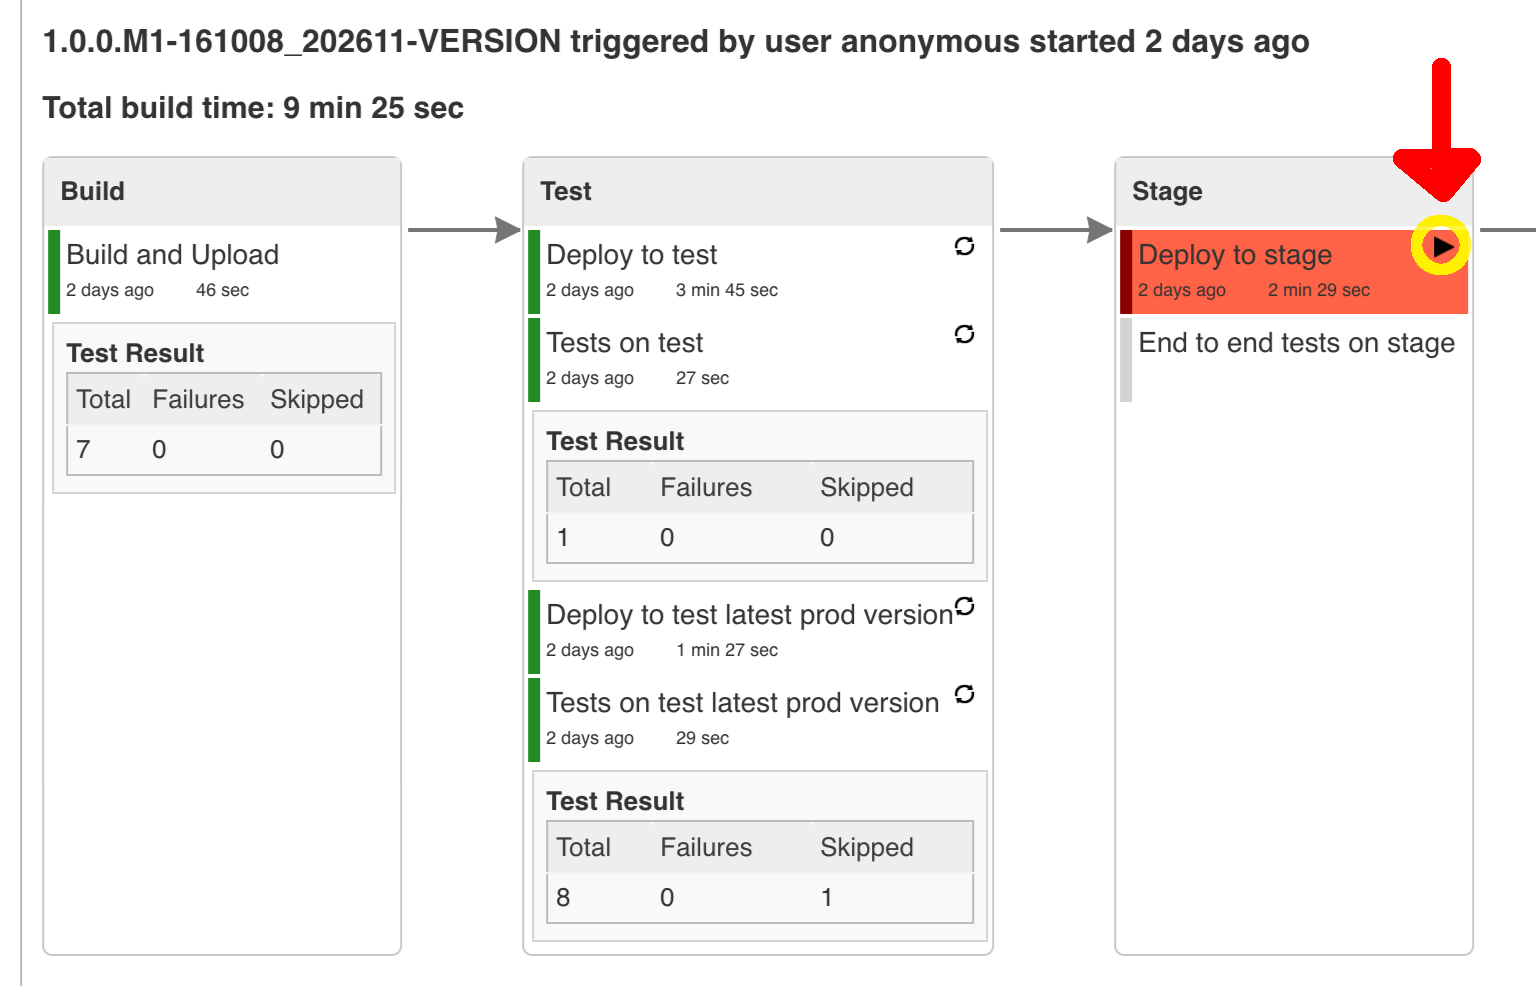
Figure 8.7. Click the manual step to go to stage (remember about killing the apps on test env). To do this click the ARROW next to the job name
| Important |
|---|---|
Most likely you will run out of memory so when reaching the stage environment it’s good to kill all apps on test. Check out the FAQ section for more details! |
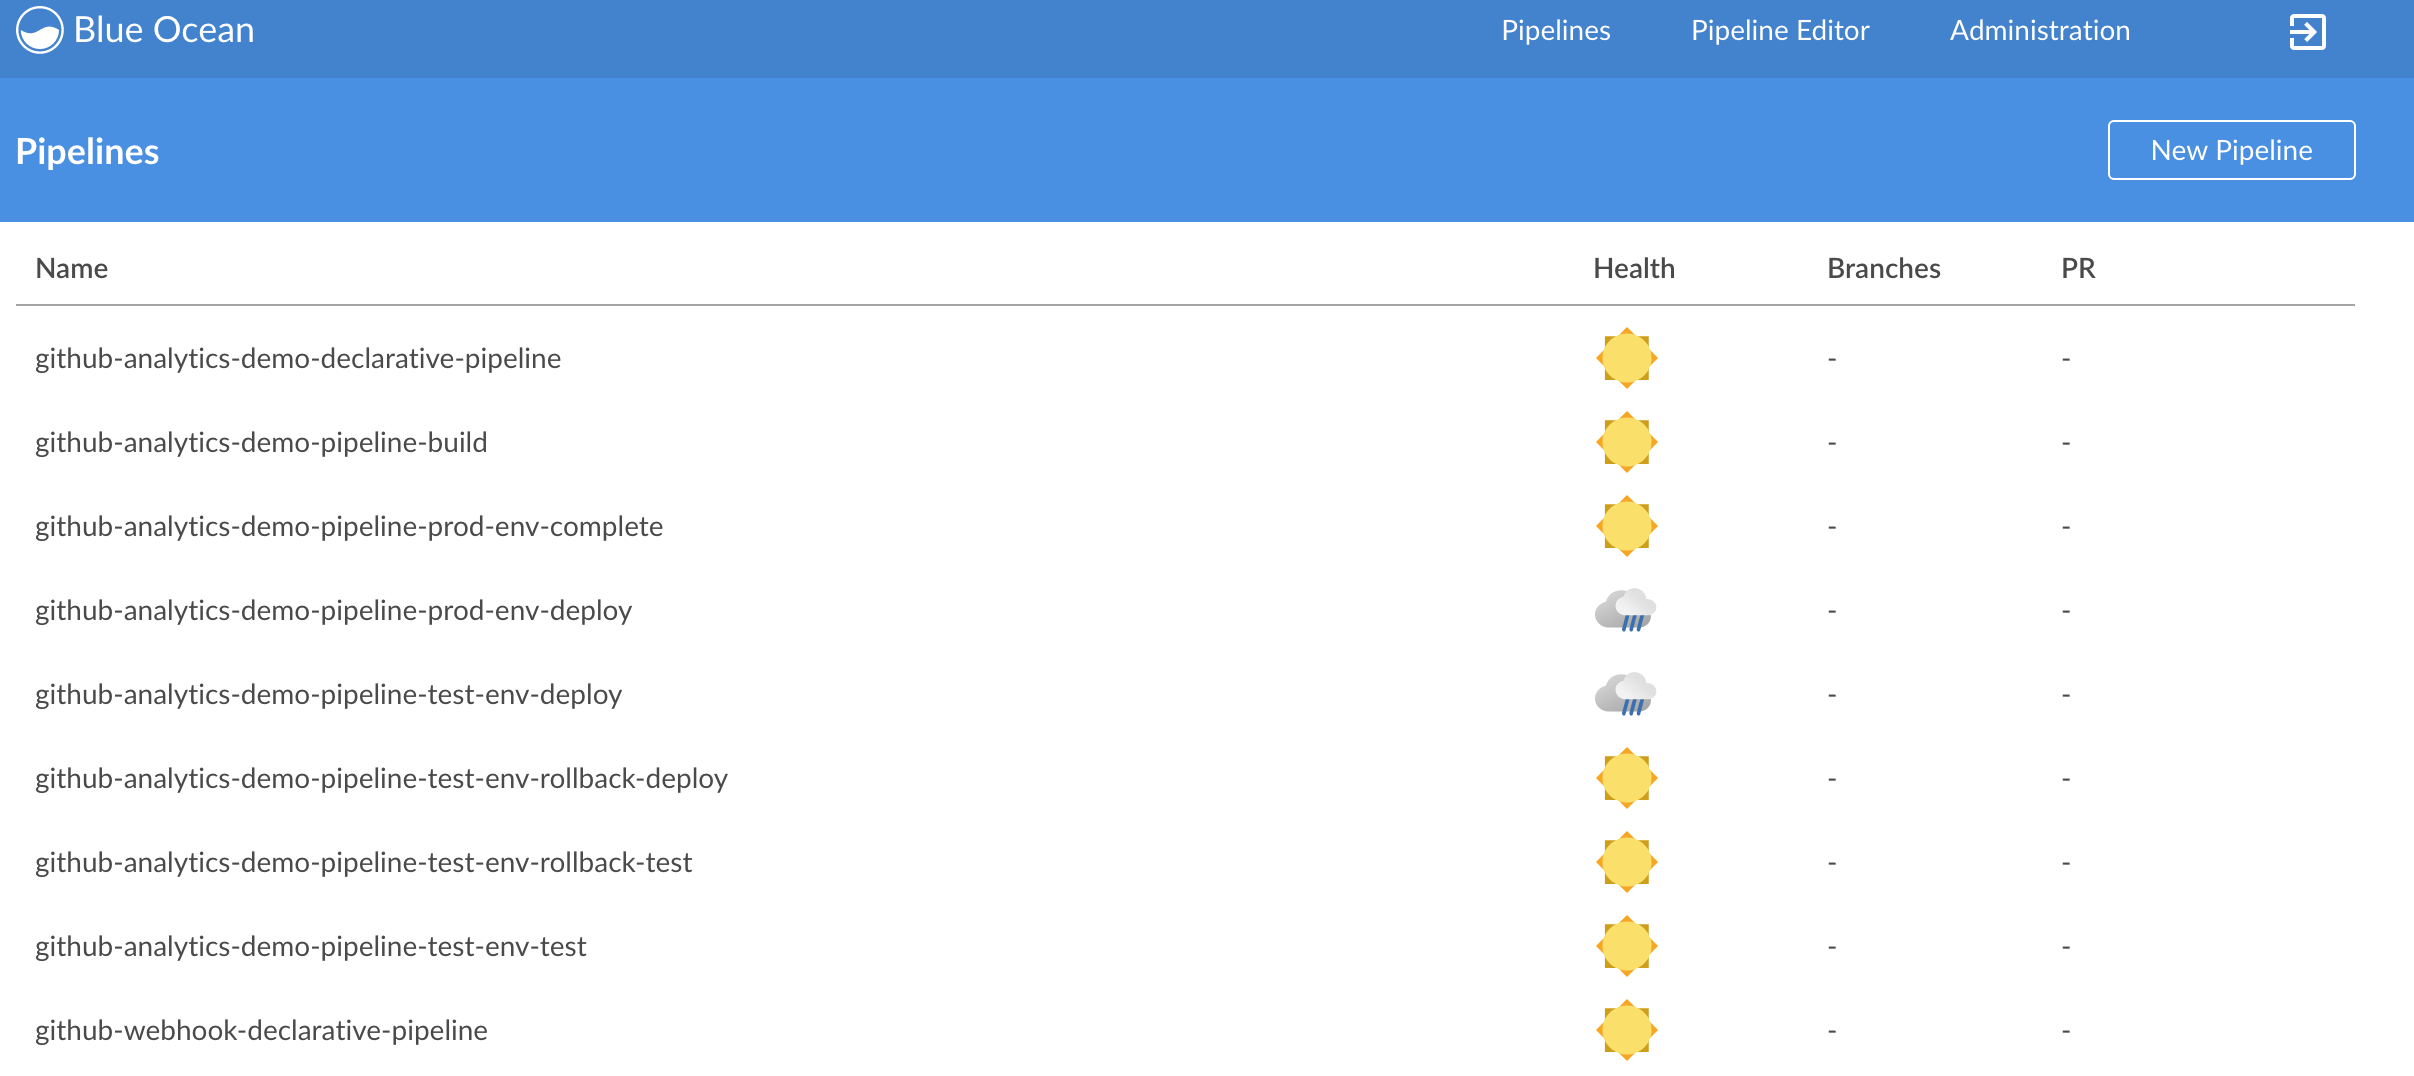
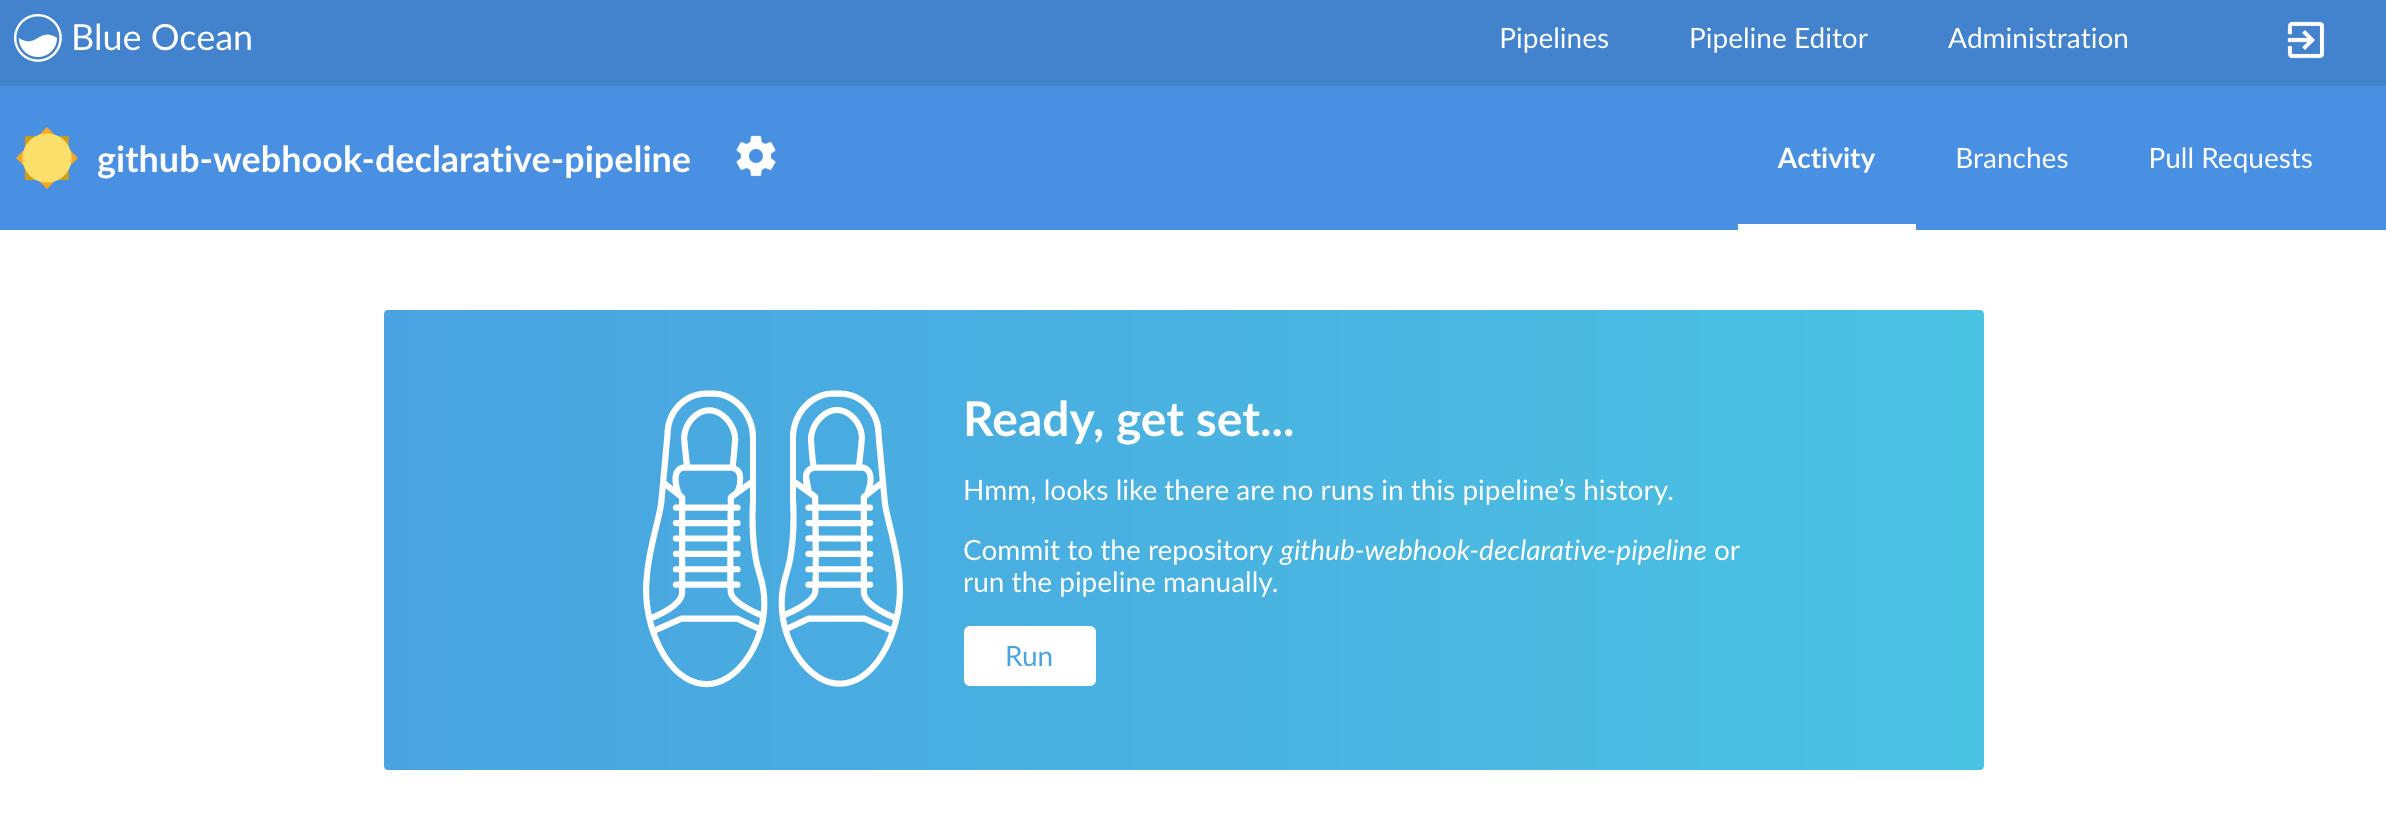
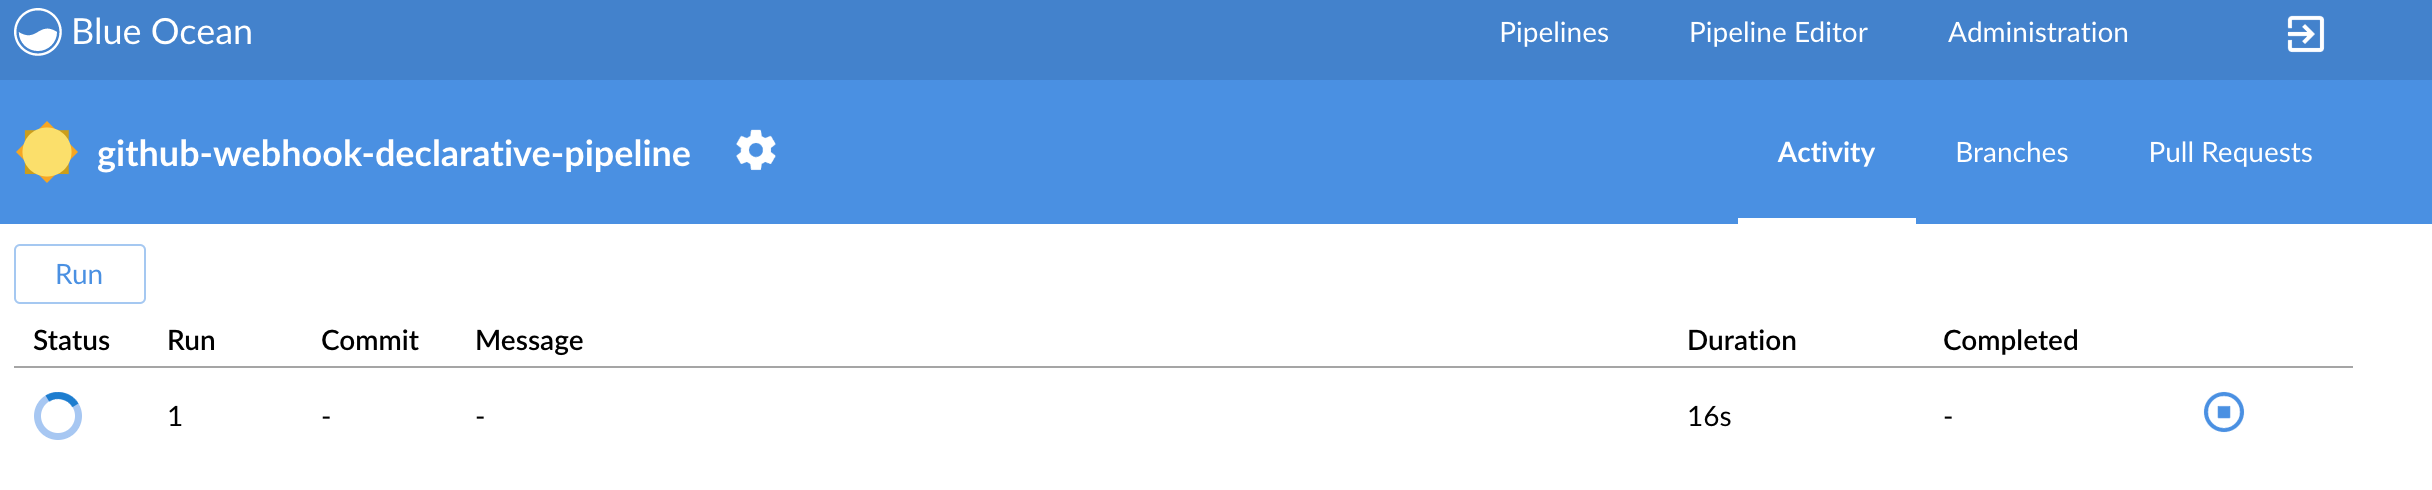
You can also use the declarative pipeline approach with the Blue Ocean UI. Here is a step by step guide to run a pipeline via this approach.
The Blue Ocean UI is available under the blue/ URL. E.g. for Docker Machine based setup http://192.168.99.100:8080/blue.
| Important |
|---|---|
There is no possibility of restarting pipeline from specific stage, after failure. Please check out this issue for more information |
| Warning |
|---|---|
Currently there is no way to introduce manual steps in a performant way. Jenkins is blocking an executor when manual step is required. That means that you’ll run out of executors pretty fast. You can check out this issue for and this StackOverflow question for more information. |
 All the steps below are not necessary to run the demo. They are needed only
when you want to do some custom changes.
The env vars that are used in all of the jobs are as follows:
| Property Name | Property Description | Default value |
|---|---|---|
BINARY_EXTENSION | Extension of the binary uploaded to Artifactory / Nexus. Example: change this to | |
PAAS_TEST_API_URL | The URL to the CF Api for TEST env | api.local.pcfdev.io |
PAAS_STAGE_API_URL | The URL to the CF Api for STAGE env | api.local.pcfdev.io |
PAAS_PROD_API_URL | The URL to the CF Api for PROD env | api.local.pcfdev.io |
PAAS_TEST_ORG | Name of the org for the test env | pcfdev-org |
PAAS_TEST_SPACE | Name of the space for the test env | pcfdev-space |
PAAS_STAGE_ORG | Name of the org for the stage env | pcfdev-org |
PAAS_STAGE_SPACE | Name of the space for the stage env | pcfdev-space |
PAAS_PROD_ORG | Name of the org for the prod env | pcfdev-org |
PAAS_PROD_SPACE | Name of the space for the prod env | pcfdev-space |
REPO_WITH_BINARIES | URL to repo with the deployed jars | |
M2_SETTINGS_REPO_ID | The id of server from Maven settings.xml | artifactory-local |
JDK_VERSION | The name of the JDK installation | jdk8 |
PIPELINE_VERSION | What should be the version of the pipeline (ultimately also version of the jar) | 1.0.0.M1-${GROOVY,script ="new Date().format('yyMMdd_HHmmss')"}-VERSION |
GIT_EMAIL | The email used by Git to tag repo | |
GIT_NAME | The name used by Git to tag repo | Pivo Tal |
PAAS_HOSTNAME_UUID | Additional suffix for the route. In a shared environment the default routes can be already taken | |
AUTO_DEPLOY_TO_STAGE | Should deployment to stage be automatic | false |
AUTO_DEPLOY_TO_PROD | Should deployment to prod be automatic | false |
API_COMPATIBILITY_STEP_REQUIRED | Should api compatibility step be required | true |
DB_ROLLBACK_STEP_REQUIRED | Should DB rollback step be present | true |
DEPLOY_TO_STAGE_STEP_REQUIRED | Should deploy to stage step be present | true |
APP_MEMORY_LIMIT | How much memory should be used by the infra apps (Eureka, Stub Runner etc.) | 256m |
JAVA_BUILDPACK_URL | The URL to the Java buildpack to be used by CF | |
BUILD_OPTIONS | Additional options you would like to pass to the Maven / Gradle build |
In your scripts we reference the credentials via IDs. These are the defaults for credentials
| Property Name | Property Description | Default value |
|---|---|---|
PAAS_PROD_CREDENTIAL_ID | Credential ID for CF Prod env access | cf-prod |
GIT_CREDENTIAL_ID | Credential ID used to tag a git repo | git |
GIT_SSH_CREDENTIAL_ID | SSH credential ID used to tag a git repo | gitSsh |
GIT_USE_SSH_KEY | if | false |
REPO_WITH_BINARIES_CREDENTIAL_ID | Credential ID used for the repo with jars | repo-with-binaries |
PAAS_TEST_CREDENTIAL_ID | Credential ID for CF Test env access | cf-test |
PAAS_STAGE_CREDENTIAL_ID | Credential ID for CF Stage env access | cf-stage |
If you already have in your system a credential to for example tag a repo
you can use it by passing the value of the property GIT_CREDENTIAL_ID
| Tip |
|---|---|
Check out the |
| Important |
|---|---|
In this chapter we assume that you perform deployment of your application to Kubernetes PaaS |
The Spring Cloud Pipelines repository contains job definitions and the opinionated setup pipeline using Jenkins Job DSL plugin. Those jobs will form an empty pipeline and a sample, opinionated one that you can use in your company.
All in all there are the following projects taking part in the whole microservice setup for this demo.
- Github Analytics - the app that has a REST endpoint and uses messaging. Our business application.
- Github Webhook - project that emits messages that are used by Github Analytics. Our business application.
- Eureka - simple Eureka Server. This is an infrastructure application.
- Github Analytics Stub Runner Boot - Stub Runner Boot server to be used for tests with Github Analytics. Uses Eureka and Messaging. This is an infrastructure application.
This is a guide for Jenkins Job DSL based pipeline.
If you want to just run the demo as far as possible using PCF Dev and Docker Compose
There are 4 apps that are composing the pipeline
You need to fork only these. That’s because only then will your user be able to tag and push the tag to repo.
Jenkins + Artifactory can be ran locally. To do that just execute the
start.sh script from this repo.
git clone https://github.com/spring-cloud/spring-cloud-pipelines
cd spring-cloud-pipelines/jenkins
./start.sh yourGitUsername yourGitPassword yourForkedGithubOrg yourDockerRegistryOrganization yourDockerRegistryUsername yourDockerRegistryPassword yourDockerRegistryEmail
Then Jenkins will be running on port 8080 and Artifactory 8081.
The provided parameters will be passed as env variables to Jenkins VM
and credentials will be set in your set. That way you don’t have to do
any manual work on the Jenkins side. In the above parameters, the third parameter
could be yourForkedGithubOrg or yourGithubUsername. Also the REPOS env variable will
contain your GitHub org in which you have the forked repos.
You need to pass the credentials for the Docker organization (by default we will search for the Docker images at Docker Hub) so that the pipeline will be able to push images to your org.
When Artifactory is running, just execute the tools/deploy-infra.sh script from this repo.
git clone https://github.com/spring-cloud/spring-cloud-pipelines
cd spring-cloud-pipelines/
./tools/deploy-infra-k8s.sh
As a result both eureka and stub runner repos will be cloned, built,
uploaded to Artifactory and their docker images will be built.
| Important |
|---|---|
Your local Docker process will be reused by the Jenkins instance running in Docker. That’s why you don’t have to push these images to Docker Hub. On the other hand if you run this sample in a remote Kubernetes cluster the driver will not be shared by the Jenkins workers so you can consider pushing these Docker images to Docker Hub too. |
We already create the seed job for you but you’ll have to run it. When you do run it you have to provide some properties. By default we create a seed that has all the properties options, but you can delete most of it. If you set the properties as global env variables you have to remove them from the seed.
Anyways, to run the demo just provide in the REPOS var the comma separated
list of URLs of the 2 aforementioned forks of github-webhook and `github-analytics'.
Figure 9.1. Click the 'jenkins-pipeline-seed-cf' job for Cloud Foundry and jenkins-pipeline-seed-k8s for Kubernetes
Figure 9.3. The REPOS parameter should already contain your forked repos (you’ll have more properties than the ones in the screenshot)
We already create the seed job for you but you’ll have to run it. When you do run it you have to provide some properties. By default we create a seed that has all the properties options, but you can delete most of it. If you set the properties as global env variables you have to remove them from the seed.
Anyways, to run the demo just provide in the REPOS var the comma separated
list of URLs of the 2 aforementioned forks of github-webhook and github-analytics.
| Important |
|---|---|
If your build fails on the deploy previous version to stage due to missing jar, that means that you’ve forgotten to clear the tags in your repo. Typically that’s due to the fact that you’ve removed the Artifactory volume with deployed JAR whereas a tag in the repo is still pointing there. Check out this section on how to remove the tag. |
Figure 9.7. Click the manual step to go to stage (remember about killing the apps on test env). To do this click the ARROW next to the job name
| Important |
|---|---|
Most likely you will run out of memory so when reaching the stage environment it’s good to kill all apps on test. Check out the FAQ section for more details! |
You can also use the declarative pipeline approach with the Blue Ocean UI. Here is a step by step guide to run a pipeline via this approach.
The Blue Ocean UI is available under the blue/ URL. E.g. for Docker Machine based setup http://192.168.99.100:8080/blue.
| Important |
|---|---|
There is no possibility of restarting pipeline from specific stage, after failure. Please check out this issue for more information |
| Warning |
|---|---|
Currently there is no way to introduce manual steps in a performant way. Jenkins is blocking an executor when manual step is required. That means that you’ll run out of executors pretty fast. You can check out this issue for and this StackOverflow question for more information. |
| Important |
|---|---|
All the steps below are not necessary to run the demo. They are needed only when you want to do some custom changes. |
The env vars that are used in all of the jobs are as follows:
| Property Name | Property Description | Default value |
|---|---|---|
BUILD_OPTIONS | Additional options you would like to pass to the Maven / Gradle build | |
DOCKER_REGISTRY_ORGANIZATION | Name of the docker organization to which Docker images should be deployed | scpipelines |
DOCKER_REGISTRY_CREDENTIAL_ID | Credential ID used to push Docker images | docker-registry |
DOCKER_SERVER_ID | Server ID in | docker-repo |
DOCKER_EMAIL | Email used to connect to Docker registry` and Maven builds | |
DOCKER_REGISTRY_ORGANIZATION | URL to Kubernetes cluster for test env | scpipelines |
DOCKER_REGISTRY_URL | URL to the docker registry | |
PAAS_TEST_API_URL | URL of the API of the Kubernetes cluster for test environment | 192.168.99.100:8443 |
PAAS_STAGE_API_URL | URL of the API of the Kubernetes cluster for stage environment | 192.168.99.100:8443 |
PAAS_PROD_API_URL | URL of the API of the Kubernetes cluster for prod environment | 192.168.99.100:8443 |
PAAS_TEST_CA_PATH | Path to the certificate authority for test environment | /usr/share/jenkins/cert/ca.crt |
PAAS_STAGE_CA_PATH | Path to the certificate authority for stage environment | /usr/share/jenkins/cert/ca.crt |
PAAS_PROD_CA_PATH | Path to the certificate authority for prod environment | /usr/share/jenkins/cert/ca.crt |
PAAS_TEST_CLIENT_CERT_PATH | Path to the client certificate for test environment | /usr/share/jenkins/cert/apiserver.crt |
PAAS_STAGE_CLIENT_CERT_PATH | Path to the client certificate for stage environment | /usr/share/jenkins/cert/apiserver.crt |
PAAS_PROD_CLIENT_CERT_PATH | Path to the client certificate for prod environment | /usr/share/jenkins/cert/apiserver.crt |
PAAS_TEST_CLIENT_KEY_PATH | Path to the client key for test environment | /usr/share/jenkins/cert/apiserver.key |
PAAS_STAGE_CLIENT_KEY_PATH | Path to the client key for stage environment | /usr/share/jenkins/cert/apiserver.key |
PAAS_PROD_CLIENT_KEY_PATH | Path to the client key for test environment | /usr/share/jenkins/cert/apiserver.key |
PAAS_TEST_CLIENT_TOKEN_PATH | Path to the file containing the token for test env | |
PAAS_STAGE_CLIENT_TOKEN_PATH | Path to the file containing the token for stage env | |
PAAS_PROD_CLIENT_TOKEN_PATH | Path to the file containing the token for prod env | |
PAAS_TEST_CLIENT_TOKEN_ID | ID of the credential containing access token for test environment | |
PAAS_STAGE_CLIENT_TOKEN_ID | ID of the credential containing access token for stage environment | |
PAAS_PROD_CLIENT_TOKEN_ID | ID of the credential containing access token for prod environment | |
PAAS_TEST_CLUSTER_NAME | Name of the cluster for test environment | minikube |
PAAS_STAGE_CLUSTER_NAME | Name of the cluster for stage environment | minikube |
PAAS_PROD_CLUSTER_NAME | Name of the cluster for prod environment | minikube |
PAAS_TEST_CLUSTER_USERNAME | Name of the user for test environment | minikube |
PAAS_STAGE_CLUSTER_USERNAME | Name of the user for stage environment | minikube |
PAAS_PROD_CLUSTER_USERNAME | Name of the user for prod environment | minikube |
PAAS_TEST_SYSTEM_NAME | Name of the system for test environment | minikube |
PAAS_STAGE_SYSTEM_NAME | Name of the system for stage environment | minikube |
PAAS_PROD_SYSTEM_NAME | Name of the system for prod environment | minikube |
PAAS_TEST_NAMESPACE | Namespace for test environment | sc-pipelines-test |
PAAS_STAGE_NAMESPACE | Namespace for stage environment | sc-pipelines-stage |
PAAS_PROD_NAMESPACE | Namespace for prod environment | sc-pipelines-prod |
KUBERNETES_MINIKUBE | Will you connect to Minikube? | true |
REPO_WITH_BINARIES | URL to repo with the deployed jars | |
REPO_WITH_BINARIES_CREDENTIAL_ID | Credential ID used for the repo with jars | repo-with-binaries |
M2_SETTINGS_REPO_ID | The id of server from Maven settings.xml | artifactory-local |
JDK_VERSION | The name of the JDK installation | jdk8 |
PIPELINE_VERSION | What should be the version of the pipeline (ultimately also version of the jar) | 1.0.0.M1-${GROOVY,script ="new Date().format('yyMMdd_HHmmss')"}-VERSION |
GIT_EMAIL | The email used by Git to tag repo | |
GIT_NAME | The name used by Git to tag repo | Pivo Tal |
AUTO_DEPLOY_TO_STAGE | Should deployment to stage be automatic | false |
AUTO_DEPLOY_TO_PROD | Should deployment to prod be automatic | false |
API_COMPATIBILITY_STEP_REQUIRED | Should api compatibility step be required | true |
DB_ROLLBACK_STEP_REQUIRED | Should DB rollback step be present | true |
DEPLOY_TO_STAGE_STEP_REQUIRED | Should deploy to stage step be present | true |
| Important |
|---|---|
Skip this step if you’re not using GCE |
In order to use GCE we need to have gcloud running. If you already have the
CLI installed, skip this step. If not just execute to have the CLI
downloaded and an installer started
$ ./tools/k8s-helper.sh download-gcloud
Next, configure gcloud. Execute gcloud init and log in
to your cluster. You will get redirected to a login page, pick the
proper Google account and log in.
Pick an existing project or create a new one.
Go to your platform page (click on Container Engine) in GCP and connect to your cluster
$ CLUSTER_NAME=...
$ ZONE=us-east1-b
$ PROJECT_NAME=...
$ gcloud container clusters get-credentials ${CLUSTER_NAME} --zone ${ZONE} --project ${PROJECT_NAME}
$ kubectl proxy
The Kubernetes dashboard will be running at http://localhost:8001/ui/.
We’ll need a Persistent Disk for our Jenkins installation. Let’s create it
$ ZONE=us-east1-b
$ gcloud compute disks create --size=200GB --zone=${ZONE} sc-pipelines-jenkins-disk
Since the disk got created now we need to format it. You can check out the instructions on how to do it here - https://cloud.google.com/compute/docs/disks/add-persistent-disk#formatting
| Important |
|---|---|
Skip this step if you’re not using Kubo or GCE |
In this section a description of steps required to deploy Jenkins and Artifactory to a Kubernetes cluster deployed via Kubo.
| Tip |
|---|---|
To see the dashboard just do |
- Log in to the cluster
Deploy Jenkins and Artifactory to the cluster
./tools/k8s-helper.sh setup-tools-infra-vspherefor a cluster deployed on VSphere./tools/k8s-helper.sh setup-tools-infra-gcefor a cluster deployed to GCE
- Forward the ports so that you can access the Jenkins UI from your local machine
$ NAMESPACE=default
$ JENKINS_POD=jenkins-1430785859-nfhx4
$ LOCAL_PORT=32044
$ CONTAINER_PORT=8080
$ kubectl port-forward --namespace=${NAMESPACE} ${JENKINS_POD} ${LOCAL_PORT}:${CONTAINER_PORT}
- Go to
Credentials, clickSystemandGlobal credentials
- Update
git,repo-with-binariesanddocker-registrycredentials Run the
jenkins-pipeline-k8s-seedseed job and fill it out with the following dataPut
kubernetes.default:443here (orKUBERNETES_API:KUBERNETES_PORT)PAAS_TEST_API_URLPAAS_STAGE_API_URLPAAS_PROD_API_URL
Put
/var/run/secrets/kubernetes.io/serviceaccount/ca.crtdata herePAAS_TEST_CA_PATHPAAS_STAGE_CA_PATHPAAS_PROD_CA_PATH
- Uncheck the
Kubernetes Minikubevalue Clear the following vars
PAAS_TEST_CLIENT_CERT_PATHPAAS_STAGE_CLIENT_CERT_PATHPAAS_PROD_CLIENT_CERT_PATHPAAS_TEST_CLIENT_KEY_PATHPAAS_STAGE_CLIENT_KEY_PATHPAAS_PROD_CLIENT_KEY_PATH
Set
/var/run/secrets/kubernetes.io/serviceaccount/tokenvalue to these varsPAAS_TEST_CLIENT_TOKEN_PATHPAAS_STAGE_CLIENT_TOKEN_PATHPAAS_STAGE_CLIENT_TOKEN_PATH
Set the cluster name to these vars (you can get it by calling
kubectl config current-context)PAAS_TEST_CLUSTER_NAMEPAAS_STAGE_CLUSTER_NAMEPAAS_PROD_CLUSTER_NAME
Set the system name to these vars (you can get it by calling
kubectl config current-context)PAAS_TEST_SYSTEM_NAMEPAAS_STAGE_SYSTEM_NAMEPAAS_PROD_SYSTEM_NAME
- Update the
DOCKER_EMAILproperty with your email - Update the
DOCKER_REGISTRY_ORGANIZATIONwith your Docker organization name - If you don’t want to upload the images to DockerHub update
DOCKER_REGISTRY_URL
- Run the pipeline
Below you can find the answers to most frequently asked questions.
You can check the Jenkins logs and you’ll see
WARNING: Skipped parameter `PIPELINE_VERSION` as it is undefined on `jenkins-pipeline-sample-build`.
	Set `-Dhudson.model.ParametersAction.keepUndefinedParameters`=true to allow undefined parameters
	to be injected as environment variables or
	`-Dhudson.model.ParametersAction.safeParameters=[comma-separated list]`
	to whitelist specific parameter names, even though it represents a security breach
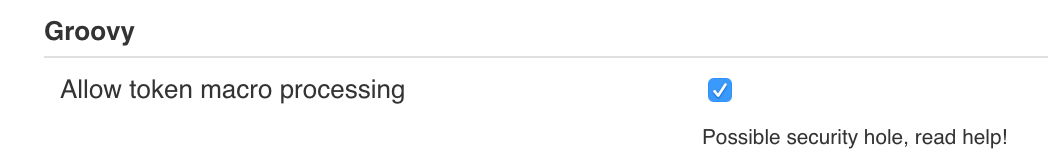
To fix it you have to do exactly what the warning suggests… Also ensure that the Groovy token macro processing
checkbox is set.
You can see that the Jenkins version is properly set but in the build version is still snapshot and
the echo "${PIPELINE_VERSION}" doesn’t print anything.
You can check the Jenkins logs and you’ll see
WARNING: Skipped parameter `PIPELINE_VERSION` as it is undefined on `jenkins-pipeline-sample-build`.
	Set `-Dhudson.model.ParametersAction.keepUndefinedParameters`=true to allow undefined parameters
	to be injected as environment variables or
	`-Dhudson.model.ParametersAction.safeParameters=[comma-separated list]`
	to whitelist specific parameter names, even though it represents a security breach
To fix it you have to do exactly what the warning suggests…
Docker compose, docker compose, docker compose… The problem is that for some reason, only in Docker, the execution of Java hangs. But it hangs randomly and only the first time you try to execute the pipeline.
The solution to this is to run the pipeline again. If once it suddenly, magically passes then it will pass for any subsequent build.
Another thing that you can try is to run it with plain Docker. Maybe that will help.
Sure! you can pass REPOS variable with comma separated list of
project_name$project_url format. If you don’t provide the PROJECT_NAME the
repo name will be extracted and used as the name of the project.
E.g. for REPOS equal to:
will result in the creation of pipelines with root names github-analytics and github-webhook.
E.g. for REPOS equal to:
foo$https://github.com/spring-cloud-samples/github-analytics,bar$https://github.com/spring-cloud-samples/atom-feed
will result in the creation of pipelines with root names foo for github-analytics
and bar for github-webhook.
Not really. This is an opinionated pipeline that’s why we took some
opinionated decisions like:
- usage of Spring Cloud, Spring Cloud Contract Stub Runner and Spring Cloud Eureka
- application deployment to Cloud Foundry
For Maven:
- usage of Maven Wrapper
- artifacts deployment by
./mvnw clean deploy stubrunner.idsproperty to retrieve list of collaborators for which stubs should be downloaded- running smoke tests on a deployed app via the
smokeMaven profile - running end to end tests on a deployed app via the
e2eMaven profile
For Gradle (in the
github-analyticsapplication check thegradle/pipeline.gradlefile):- usage of Gradlew Wrapper
deploytask for artifacts deployment- running smoke tests on a deployed app via the
smoketask - running end to end tests on a deployed app via the
e2etask groupIdtask to retrieve group idartifactIdtask to retrieve artifact idcurrentVersiontask to retrieve the current versionstubIdstask to retrieve list of collaborators for which stubs should be downloaded
This is the initial approach that can be easily changed in the future.
Sure! It’s open-source! The important thing is that the core part of the logic is written in Bash scripts. That way, in the majority of cases, you could change only the bash scripts without changing the whole pipeline.
You must have pushed some tags and have removed the Artifactory volume that contained them. To fix this, just remove the tags
git tag -l | xargs -n 1 git push --delete origin- by default we assume that you have jdk with id
jdk8configured - if you want a different one just override
JDK_VERSIONenv var and point to the proper one
| Tip |
|---|---|
The docker image comes in with Java installed at |
To change the default one just follow these steps:
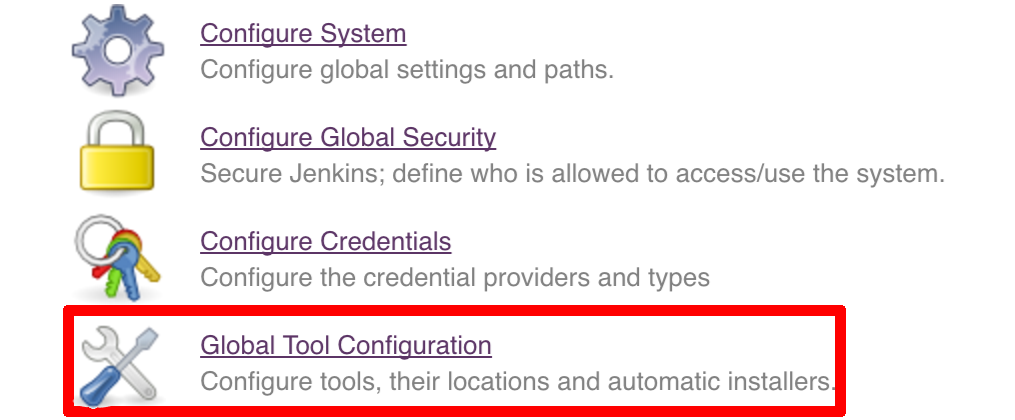
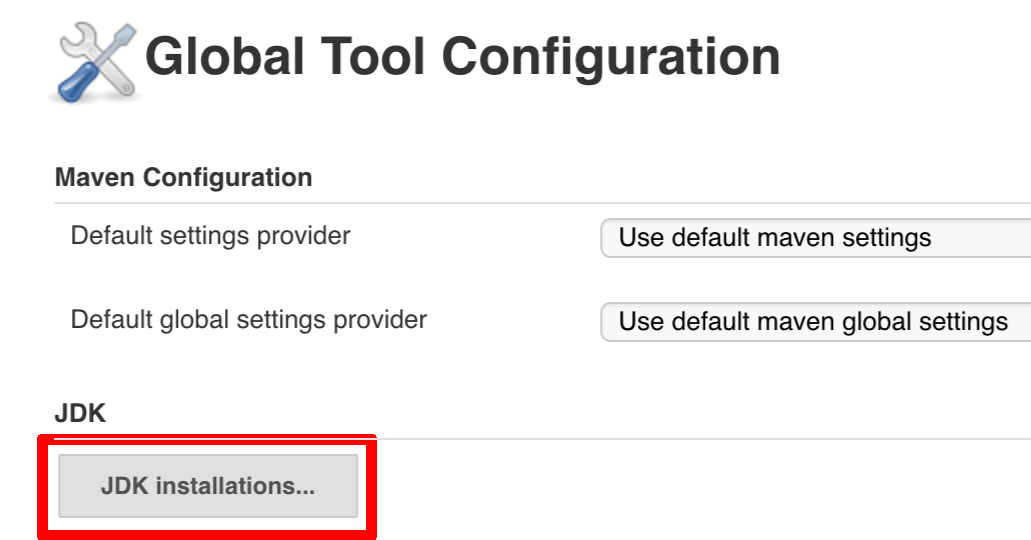
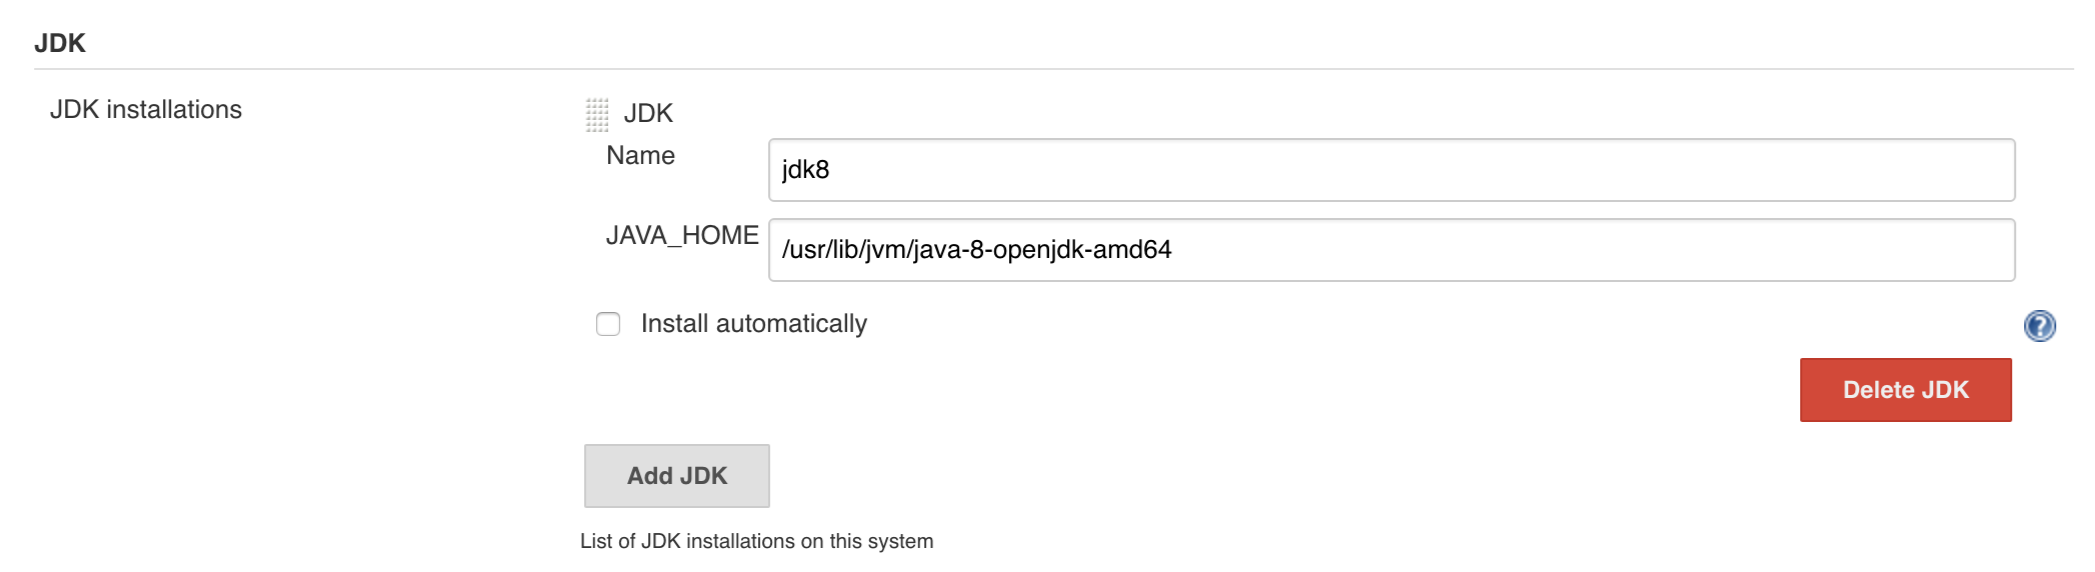
And that’s it!
With scripted that but if you needed to this manually then this is how to do it:
No problem, just set the property / env var to true
AUTO_DEPLOY_TO_STAGEto automatically deploy to stageAUTO_DEPLOY_TO_PRODto automatically deploy to prod
No problem, just set the API_COMPATIBILITY_STEP_REQUIRED env variable
to false and rerun the seed (you can pick it from the seed
job’s properties too).
When you get sth like this:
19:01:44 stderr: remote: Invalid username or password.
19:01:44 fatal: Authentication failed for 'https://github.com/marcingrzejszczak/github-webhook/'
19:01:44
19:01:44 	at org.jenkinsci.plugins.gitclient.CliGitAPIImpl.launchCommandIn(CliGitAPIImpl.java:1740)
19:01:44 	at org.jenkinsci.plugins.gitclient.CliGitAPIImpl.launchCommandWithCredentials(CliGitAPIImpl.java:1476)
19:01:44 	at org.jenkinsci.plugins.gitclient.CliGitAPIImpl.access$300(CliGitAPIImpl.java:63)
19:01:44 	at org.jenkinsci.plugins.gitclient.CliGitAPIImpl$8.execute(CliGitAPIImpl.java:1816)
19:01:44 	at hudson.plugins.git.GitPublisher.perform(GitPublisher.java:295)
19:01:44 	at hudson.tasks.BuildStepMonitor$3.perform(BuildStepMonitor.java:45)
19:01:44 	at hudson.model.AbstractBuild$AbstractBuildExecution.perform(AbstractBuild.java:779)
19:01:44 	at hudson.model.AbstractBuild$AbstractBuildExecution.performAllBuildSteps(AbstractBuild.java:720)
19:01:44 	at hudson.model.Build$BuildExecution.post2(Build.java:185)
19:01:44 	at hudson.model.AbstractBuild$AbstractBuildExecution.post(AbstractBuild.java:665)
19:01:44 	at hudson.model.Run.execute(Run.java:1745)
19:01:44 	at hudson.model.FreeStyleBuild.run(FreeStyleBuild.java:43)
19:01:44 	at hudson.model.ResourceController.execute(ResourceController.java:98)
19:01:44 	at hudson.model.Executor.run(Executor.java:404)
most likely you’ve passed a wrong password. Check the credentials section on how to update your credentials.
Most likely you’ve forgotten to update your local settings.xml with the Artifactory’s
setup. Check out this section of the docs and update your settings.xml.
In some cases it may be required that when performing a release that the artifacts be signed
before pushing them to the repository.
To do this you will need to import your GPG keys into the Docker image running Jenkins.
This can be done by placing a file called public.key containing your public key
and a file called private.key containing your private key in the seed directory.
These keys will be imported by the init.groovy script that is run when Jenkins starts.
The seed job checks if an env variable GIT_USE_SSH_KEY is set to true. If that’s the case
then env variable GIT_SSH_CREDENTIAL_ID will be chosen as the one that contains the
id of the credential that contains SSH private key. By default GIT_CREDENTIAL_ID will be picked
as the one that contains username and password to connect to git.
You can set these values in the seed job by filling out the form / toggling a checkbox.
There can be a number of reason but remember that for stage we assume that a sequence of manual steps need to be performed. We don’t redeploy any existing services cause most likely you deliberately have set it up in that way or the other. If in the logs of your application you can see that you can’t connect to a service, first ensure that the service is forwarding traffic to a pod. Next if that’s not the case please delete the service and re-run the step in the pipeline. That way Spring Cloud Pipelines will redeploy the service and the underlying pods.
[jenkins-cf-resources]] When deploying the app to stage or prod you can get an exception Insufficient resources. The way to
solve it is to kill some apps from test / stage env. To achieve that just call
cf target -o pcfdev-org -s pcfdev-test
cf stop github-webhook
cf stop github-eureka
cf stop stubrunner
You can also execute ./tools/cf-helper.sh kill-all-apps that will remove all demo-related apps
deployed to PCF Dev.
If you receive a similar exception:
20:26:18 API endpoint:   https://api.local.pcfdev.io (API version: 2.58.0)
20:26:18 User:           user
20:26:18 Org:            pcfdev-org
20:26:18 Space:          No space targeted, use 'cf target -s SPACE'
20:26:18 FAILED
20:26:18 Error finding space pcfdev-test
20:26:18 Space pcfdev-test not found
It means that you’ve forgotten to create the spaces in your PCF Dev installation.
If you play around with Jenkins / Concourse you might end up with the routes occupied
Using route github-webhook-test.local.pcfdev.io
Binding github-webhook-test.local.pcfdev.io to github-webhook...
FAILED
The route github-webhook-test.local.pcfdev.io is already in use.
Just delete the routes
yes | cf delete-route local.pcfdev.io -n github-webhook-test
yes | cf delete-route local.pcfdev.io -n github-eureka-test
yes | cf delete-route local.pcfdev.io -n stubrunner-test
yes | cf delete-route local.pcfdev.io -n github-webhook-stage
yes | cf delete-route local.pcfdev.io -n github-eureka-stage
yes | cf delete-route local.pcfdev.io -n github-webhook-prod
yes | cf delete-route local.pcfdev.io -n github-eureka-prod
You can also execute the ./tools/cf-helper.sh delete-routes
Assuming that you’re already logged into the cluster it’s enough to run the
helper script with the REUSE_CF_LOGIN=true env variable. Example:
REUSE_CF_LOGIN=true ./tools/cf-helper.sh setup-prod-infra
This script will create the mysql db, rabbit mq service, download and deploy Eureka to the space and organization you’re logged into.
First you’ll need to install the kubectl CLI.
You can use the tools/k8s-helper.sh script to install kubectl. Just call
$ ./tools/minikube-helper download-kubectl
and then the kubectl will get downloaded
Example for OSX
$ curl -LO https://storage.googleapis.com/kubernetes-release/release/$(curl -s https://storage.googleapis.com/kubernetes-release/release/stable.txt)/bin/darwin/amd64/kubectl
$ chmod +x ./kubectl
$ sudo mv ./kubectl /usr/local/bin/kubectl
Example for Linux
$ curl -LO https://storage.googleapis.com/kubernetes-release/release/$(curl -s https://storage.googleapis.com/kubernetes-release/release/stable.txt)/bin/linux/amd64/kubectl
$ chmod +x ./kubectl
$ sudo mv ./kubectl /usr/local/bin/kubectl
Check out this page for more information.
We need a cluster of Kubernetes. The best choice will be Minikube.
| Tip |
|---|---|
You can skip this step if you have Kubernetes cluster installed and don’t want to use Minikube The only thing you have to do is to set up spaces. |
| Warning |
|---|---|
It’s more than likely that you’ll run out of resources when you reach stage step. Don’t worry! Keep calm and clear some apps from Minikube and continue. |
You can use the tools/k8s-helper.sh script to install Minikube. Just call
$ ./tools/minikube-helper download-minikube
and then the Minikube cluster will get downloaded
Example for OSX
$ curl -Lo minikube https://storage.googleapis.com/minikube/releases/v0.20.0/minikube-darwin-amd64 && chmod +x minikube && sudo mv minikube /usr/local/bin/Feel free to leave off the sudo mv minikube /usr/local/bin if you would like to add minikube to your path manually.
Example for Linux
$ curl -Lo minikube https://storage.googleapis.com/minikube/releases/v0.20.0/minikube-linux-amd64 && chmod +x minikube && sudo mv minikube /usr/local/bin/Feel free to leave off the sudo mv minikube /usr/local/bin if you would like to add minikube to your path manually.
Check out this page for more info on the installation.
Just type in minikube start to start Kubernetes on your local box.
To add the dashboard just execute minikube dashboard
By default if you install Minikube all the certificates get installed in your
~/.minikube folder. Your kubectl configuration under ~/.kube/config will also
get updated to use Minikube.
| Important |
|---|---|
If you just want to run the default, demo setup you can skip this section |
To target a given Kubernetes instance one needs to pass around Certificate Authority key and also user keys.
You can read more about the instructions on how to generate those keys here.
Generally speaking if you have a Kubernetes installation (e.g. minikube) this step
has already been done for you. Time to reuse those keys on the workers.
Extracted from the official docs.
Configure kubectl to connect to the target cluster using the following commands, replacing several values as indicated:
- Replace
${MASTER_HOST}with the master node address or name used in previous steps - Replace
${CA_CERT}with the absolute path to theca.pemcreated in previous steps - Replace
${ADMIN_KEY}with the absolute path to theadmin-key.pemcreated in previous steps - Replace
${ADMIN_CERT}with the absolute path to theadmin.pemcreated in previous steps
$ kubectl config set-cluster default-cluster --server=https://${MASTER_HOST} --certificate-authority=${CA_CERT}
$ kubectl config set-credentials default-admin --certificate-authority=${CA_CERT} --client-key=${ADMIN_KEY} --client-certificate=${ADMIN_CERT}
$ kubectl config set-context default-system --cluster=default-cluster --user=default-admin
$ kubectl config use-context default-systemThe demo uses 2 applications. Github Webhook and Github analytics code. Below you can see an image of how these application communicate with each other.
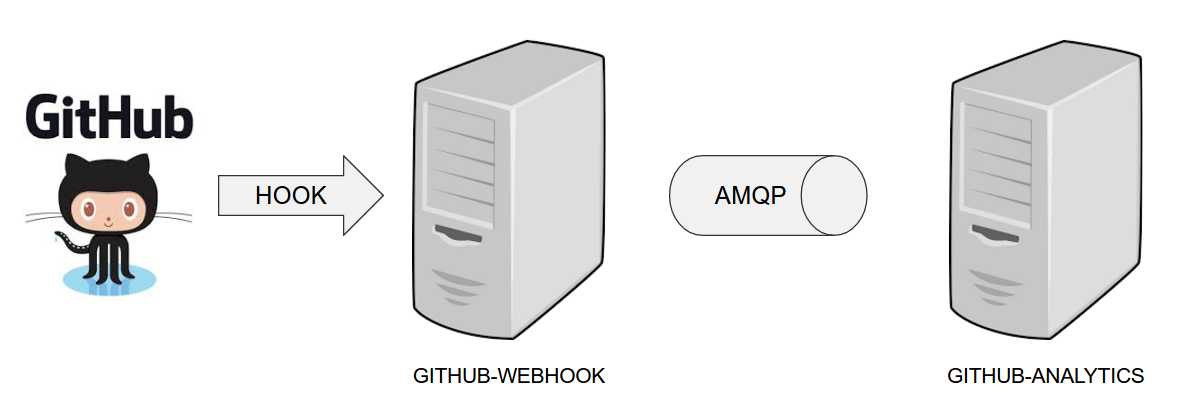
For the demo scenario we have two applications. Github Analytics and Github Webhook.
Let’s imagine a case where Github is emitting events via HTTP. Github Webhook has
an API that could register to such hooks and receive those messages. Once this happens
Github Webhook sends a message by RabbitMQ to a channel. Github Analytics is
listening to those messages and stores them in a MySQL database.
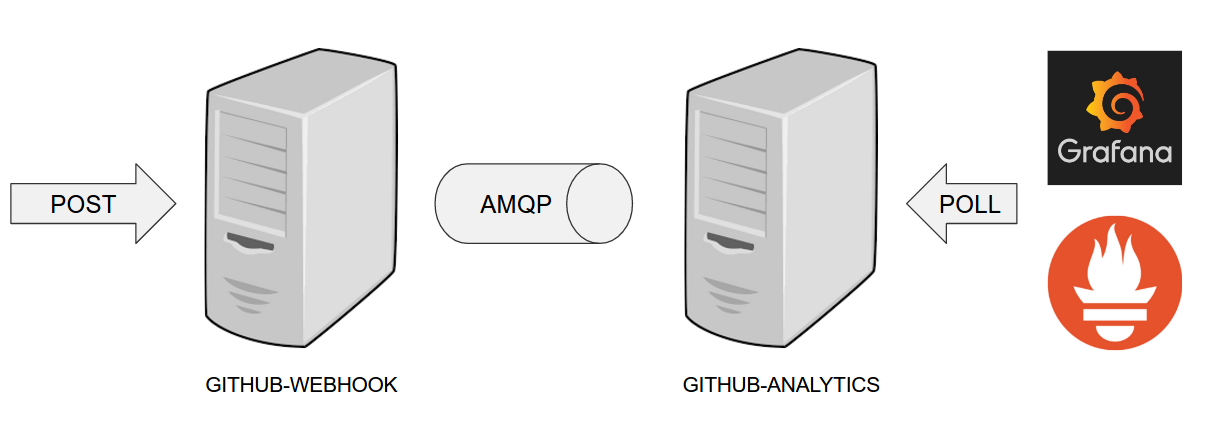
Github Analytics has its KPIs (Key Performance Indicators) monitored. In the case
of that application the KPI is number of issues.
Let’s assume that if we go below the threshold of X issues then an alert should be sent to Slack.
In the real world scenario we wouldn’t want to automatically provision services like
RabbitMQ, MySQL or Eureka each time we deploy a new application to production. Typically
production is provisioned manually (using automated solutions). In our case, before
you deploy to production you can provision the pcfdev-prod space using the
cf-helper.sh. Just call
$ ./cf-helper.sh setup-prod-infra
What will happen is that the CF CLI will login to PCF Dev, target pcfdev-prod space,
setup RabbitMQ (under rabbitmq-github name), MySQL (under mysql-github-analytics name)
and Eureka (under github-eureka name).
You can check out Toshiaki Maki’s code on how to automate Prometheus installation on CF.
Go to https://prometheus.io/download/ and download linux binary. Then call:
cf push sc-pipelines-prometheus -b binary_buildpack -c './prometheus -web.listen-address=:8080' -m 64m
Also localhost:9090 in prometheus.yml should be localhost:8080.
The file should look like this to work with the demo setup (change github-analytics-sc-pipelines.cfapps.io
to your github-analytics installation).
# my global config
global:
  scrape_interval:     15s # Set the scrape interval to every 15 seconds. Default is every 1 minute.
  evaluation_interval: 15s # Evaluate rules every 15 seconds. The default is every 1 minute.
  # scrape_timeout is set to the global default (10s).

  # Attach these labels to any time series or alerts when communicating with
  # external systems (federation, remote storage, Alertmanager).
  external_labels:
      monitor: 'codelab-monitor'

# Load rules once and periodically evaluate them according to the global 'evaluation_interval'.
rule_files:
  # - "first.rules"
  # - "second.rules"

# A scrape configuration containing exactly one endpoint to scrape:
# Here it's Prometheus itself.
scrape_configs:
  # The job name is added as a label `job=<job_name>` to any timeseries scraped from this config.
  - job_name: 'prometheus'

    # metrics_path defaults to '/metrics'
    # scheme defaults to 'http'.

    static_configs:
      - targets: ['localhost:8080']

  - job_name: 'demo-app'

    # Override the global default and scrape targets from this job every 5 seconds.
    scrape_interval: 5s

    metrics_path: '/prometheus'
    # scheme defaults to 'http'.

    static_configs:
      - targets: ['github-analytics-sc-pipelines.cfapps.io']
A deployed version for the Spring Cloud Pipelines demo is available here
You can check out Toshiaki Maki’s code on how to automate Prometheus installation on CF.
Download tarball from https://grafana.com/grafana/download?platform=linux
Next set http_port = 8080 in conf/default.ini. Then call
cf push sc-pipelines-grafana -b binary_buildpack -c './bin/grafana-server web' -m 64m
The demo is using Grafana Dashboard with ID 2471.
A deployed version for the Spring Cloud Pipelines demo is available here
The demo uses 2 applications. Github Webhook and Github analytics code. Below you can see an image of how these application communicate with each other.
For the demo scenario we have two applications. Github Analytics and Github Webhook.
Let’s imagine a case where Github is emitting events via HTTP. Github Webhook has
an API that could register to such hooks and receive those messages. Once this happens
Github Webhook sends a message by RabbitMQ to a channel. Github Analytics is
listening to those messages and stores them in a MySQL database.
Github Analytics has its KPIs (Key Performance Indicators) monitored. In the case
of that application the KPI is number of issues.
Let’s assume that if we go below the threshold of X issues then an alert should be sent to Slack.
In the real world scenario we wouldn’t want to automatically provision services like
RabbitMQ, MySQL or Eureka each time we deploy a new application to production. Typically
production is provisioned manually (using automated solutions). In our case, before
you deploy to production you can provision the sc-pipelines-prod namespace using the
k8s-helper.sh. Just call
$ ./k8s-helper.sh setup-prod-infra
Use Helm to install Prometheus. We will point it to the services deployed to our cluster.
Create a file called values.yaml.
values.yaml.
rbac:
  create: false

alertmanager:
  ## If false, alertmanager will not be installed
  ##
  enabled: true

  # Defines the serviceAccountName to use when `rbac.create=false`
  serviceAccountName: default

  ## alertmanager container name
  ##
  name: alertmanager

  ## alertmanager container image
  ##
  image:
    repository: prom/alertmanager
    tag: v0.9.1
    pullPolicy: IfNotPresent

  ## Additional alertmanager container arguments
  ##
  extraArgs: {}

  ## The URL prefix at which the container can be accessed. Useful in the case the '-web.external-url' includes a slug
  ## so that the various internal URLs are still able to access as they are in the default case.
  ## (Optional)
  baseURL: ""

  ## Additional alertmanager container environment variable
  ## For instance to add a http_proxy
  ##
  extraEnv: {}

  ## ConfigMap override where fullname is {{.Release.Name}}-{{.Values.alertmanager.configMapOverrideName}}
  ## Defining configMapOverrideName will cause templates/alertmanager-configmap.yaml
  ## to NOT generate a ConfigMap resource
  ##
  configMapOverrideName: ""

  ingress:
    ## If true, alertmanager Ingress will be created
    ##
    enabled: false

    ## alertmanager Ingress annotations
    ##
    annotations: {}
    #   kubernetes.io/ingress.class: nginx
    #   kubernetes.io/tls-acme: 'true'

    ## alertmanager Ingress hostnames
    ## Must be provided if Ingress is enabled
    ##
    hosts: []
    #   - alertmanager.domain.com

    ## alertmanager Ingress TLS configuration
    ## Secrets must be manually created in the namespace
    ##
    tls: []
    #   - secretName: prometheus-alerts-tls
    #     hosts:
    #       - alertmanager.domain.com

  ## Alertmanager Deployment Strategy type
  # strategy:
  #   type: Recreate

  ## Node labels for alertmanager pod assignment
  ## Ref: https://kubernetes.io/docs/user-guide/node-selection/
  ##
  nodeSelector: {}

  persistentVolume:
    ## If true, alertmanager will create/use a Persistent Volume Claim
    ## If false, use emptyDir
    ##
    enabled: true

    ## alertmanager data Persistent Volume access modes
    ## Must match those of existing PV or dynamic provisioner
    ## Ref: http://kubernetes.io/docs/user-guide/persistent-volumes/
    ##
    accessModes:
      - ReadWriteOnce

    ## alertmanager data Persistent Volume Claim annotations
    ##
    annotations: {}

    ## alertmanager data Persistent Volume existing claim name
    ## Requires alertmanager.persistentVolume.enabled: true
    ## If defined, PVC must be created manually before volume will be bound
    existingClaim: ""

    ## alertmanager data Persistent Volume mount root path
    ##
    mountPath: /data

    ## alertmanager data Persistent Volume size
    ##
    size: 2Gi

    ## alertmanager data Persistent Volume Storage Class
    ## If defined, storageClassName: <storageClass>
    ## If set to "-", storageClassName: "", which disables dynamic provisioning
    ## If undefined (the default) or set to null, no storageClassName spec is
    ##   set, choosing the default provisioner.  (gp2 on AWS, standard on
    ##   GKE, AWS & OpenStack)
    ##
    # storageClass: "-"

    ## Subdirectory of alertmanager data Persistent Volume to mount
    ## Useful if the volume's root directory is not empty
    ##
    subPath: ""

  ## Annotations to be added to alertmanager pods
  ##
  podAnnotations: {}

  replicaCount: 1

  ## alertmanager resource requests and limits
  ## Ref: http://kubernetes.io/docs/user-guide/compute-resources/
  ##
  resources: {}
    # limits:
    #   cpu: 10m
    #   memory: 32Mi
    # requests:
    #   cpu: 10m
    #   memory: 32Mi

  service:
    annotations: {}
    labels: {}
    clusterIP: ""

    ## List of IP addresses at which the alertmanager service is available
    ## Ref: https://kubernetes.io/docs/user-guide/services/#external-ips
    ##
    externalIPs: []

    loadBalancerIP: ""
    loadBalancerSourceRanges: []
    servicePort: 80
    # nodePort: 30000
    type: ClusterIP

## Monitors ConfigMap changes and POSTs to a URL
## Ref: https://github.com/jimmidyson/configmap-reload
##
configmapReload:
  ## configmap-reload container name
  ##
  name: configmap-reload

  ## configmap-reload container image
  ##
  image:
    repository: jimmidyson/configmap-reload
    tag: v0.1
    pullPolicy: IfNotPresent

  ## configmap-reload resource requests and limits
  ## Ref: http://kubernetes.io/docs/user-guide/compute-resources/
  ##
  resources: {}

kubeStateMetrics:
  ## If false, kube-state-metrics will not be installed
  ##
  enabled: true

  # Defines the serviceAccountName to use when `rbac.create=false`
  serviceAccountName: default

  ## kube-state-metrics container name
  ##
  name: kube-state-metrics

  ## kube-state-metrics container image
  ##
  image:
    repository: gcr.io/google_containers/kube-state-metrics
    tag: v1.1.0-rc.0
    pullPolicy: IfNotPresent

  ## Node labels for kube-state-metrics pod assignment
  ## Ref: https://kubernetes.io/docs/user-guide/node-selection/
  ##
  nodeSelector: {}

  ## Annotations to be added to kube-state-metrics pods
  ##
  podAnnotations: {}

  replicaCount: 1

  ## kube-state-metrics resource requests and limits
  ## Ref: http://kubernetes.io/docs/user-guide/compute-resources/
  ##
  resources: {}
    # limits:
    #   cpu: 10m
    #   memory: 16Mi
    # requests:
    #   cpu: 10m
    #   memory: 16Mi

  service:
    annotations:
      prometheus.io/scrape: "true"
    labels: {}

    clusterIP: None

    ## List of IP addresses at which the kube-state-metrics service is available
    ## Ref: https://kubernetes.io/docs/user-guide/services/#external-ips
    ##
    externalIPs: []

    loadBalancerIP: ""
    loadBalancerSourceRanges: []
    servicePort: 80
    type: ClusterIP

nodeExporter:
  ## If false, node-exporter will not be installed
  ##
  enabled: true

  # Defines the serviceAccountName to use when `rbac.create=false`
  serviceAccountName: default

  ## node-exporter container name
  ##
  name: node-exporter

  ## node-exporter container image
  ##
  image:
    repository: prom/node-exporter
    tag: v0.15.0
    pullPolicy: IfNotPresent

  ## Additional node-exporter container arguments
  ##
  extraArgs: {}

  ## Additional node-exporter hostPath mounts
  ##
  extraHostPathMounts: []
    # - name: textfile-dir
    #   mountPath: /srv/txt_collector
    #   hostPath: /var/lib/node-exporter
    #   readOnly: true

  ## Node tolerations for node-exporter scheduling to nodes with taints
  ## Ref: https://kubernetes.io/docs/concepts/configuration/assign-pod-node/
  ##
  tolerations: []
    # - key: "key"
    #   operator: "Equal|Exists"
    #   value: "value"
    #   effect: "NoSchedule|PreferNoSchedule|NoExecute(1.6 only)"

  ## Node labels for node-exporter pod assignment
  ## Ref: https://kubernetes.io/docs/user-guide/node-selection/
  ##
  nodeSelector: {}

  ## Annotations to be added to node-exporter pods
  ##
  podAnnotations: {}

  ## node-exporter resource limits & requests
  ## Ref: https://kubernetes.io/docs/user-guide/compute-resources/
  ##
  resources: {}
    # limits:
    #   cpu: 200m
    #   memory: 50Mi
    # requests:
    #   cpu: 100m
    #   memory: 30Mi

  service:
    annotations:
      prometheus.io/scrape: "true"
    labels: {}

    clusterIP: None

    ## List of IP addresses at which the node-exporter service is available
    ## Ref: https://kubernetes.io/docs/user-guide/services/#external-ips
    ##
    externalIPs: []

    hostPort: 9100
    loadBalancerIP: ""
    loadBalancerSourceRanges: []
    servicePort: 9100
    type: ClusterIP

server:
  ## Prometheus server container name
  ##
  name: server

  # Defines the serviceAccountName to use when `rbac.create=false`
  serviceAccountName: default

  ## Prometheus server container image
  ##
  image:
    repository: prom/prometheus
    tag: v1.8.0
    pullPolicy: IfNotPresent

  ## (optional) alertmanager URL
  ## only used if alertmanager.enabled = false
  alertmanagerURL: ""

  ## The URL prefix at which the container can be accessed. Useful in the case the '-web.external-url' includes a slug
  ## so that the various internal URLs are still able to access as they are in the default case.
  ## (Optional)
  baseURL: ""

  ## Additional Prometheus server container arguments
  ##
  extraArgs: {}

  ## Additional Prometheus server hostPath mounts
  ##
  extraHostPathMounts: []
    # - name: certs-dir
    #   mountPath: /etc/kubernetes/certs
    #   hostPath: /etc/kubernetes/certs
    #   readOnly: true

  ## ConfigMap override where fullname is {{.Release.Name}}-{{.Values.server.configMapOverrideName}}
  ## Defining configMapOverrideName will cause templates/server-configmap.yaml
  ## to NOT generate a ConfigMap resource
  ##
  configMapOverrideName: ""

  ingress:
    ## If true, Prometheus server Ingress will be created
    ##
    enabled: false

    ## Prometheus server Ingress annotations
    ##
    annotations: {}
    #   kubernetes.io/ingress.class: nginx
    #   kubernetes.io/tls-acme: 'true'

    ## Prometheus server Ingress hostnames
    ## Must be provided if Ingress is enabled
    ##
    hosts: []
    #   - prometheus.domain.com

    ## Prometheus server Ingress TLS configuration
    ## Secrets must be manually created in the namespace
    ##
    tls: []
    #   - secretName: prometheus-server-tls
    #     hosts:
    #       - prometheus.domain.com

  ## Server Deployment Strategy type
  # strategy:
  #   type: Recreate

  ## Node tolerations for server scheduling to nodes with taints
  ## Ref: https://kubernetes.io/docs/concepts/configuration/assign-pod-node/
  ##
  tolerations: []
    # - key: "key"
    #   operator: "Equal|Exists"
    #   value: "value"
    #   effect: "NoSchedule|PreferNoSchedule|NoExecute(1.6 only)"

  ## Node labels for Prometheus server pod assignment
  ## Ref: https://kubernetes.io/docs/user-guide/node-selection/
  nodeSelector: {}

  persistentVolume:
    ## If true, Prometheus server will create/use a Persistent Volume Claim
    ## If false, use emptyDir
    ##
    enabled: true

    ## Prometheus server data Persistent Volume access modes
    ## Must match those of existing PV or dynamic provisioner
    ## Ref: http://kubernetes.io/docs/user-guide/persistent-volumes/
    ##
    accessModes:
      - ReadWriteOnce

    ## Prometheus server data Persistent Volume annotations
    ##
    annotations: {}

    ## Prometheus server data Persistent Volume existing claim name
    ## Requires server.persistentVolume.enabled: true
    ## If defined, PVC must be created manually before volume will be bound
    existingClaim: ""

    ## Prometheus server data Persistent Volume mount root path
    ##
    mountPath: /data

    ## Prometheus server data Persistent Volume size
    ##
    size: 8Gi

    ## Prometheus server data Persistent Volume Storage Class
    ## If defined, storageClassName: <storageClass>
    ## If set to "-", storageClassName: "", which disables dynamic provisioning
    ## If undefined (the default) or set to null, no storageClassName spec is
    ##   set, choosing the default provisioner.  (gp2 on AWS, standard on
    ##   GKE, AWS & OpenStack)
    ##
    # storageClass: "-"

    ## Subdirectory of Prometheus server data Persistent Volume to mount
    ## Useful if the volume's root directory is not empty
    ##
    subPath: ""

  ## Annotations to be added to Prometheus server pods
  ##
  podAnnotations: {}
    # iam.amazonaws.com/role: prometheus

  replicaCount: 1

  ## Prometheus server resource requests and limits
  ## Ref: http://kubernetes.io/docs/user-guide/compute-resources/
  ##
  resources: {}
    # limits:
    #   cpu: 500m
    #   memory: 512Mi
    # requests:
    #   cpu: 500m
    #   memory: 512Mi

  service:
    annotations: {}
    labels: {}
    clusterIP: ""

    ## List of IP addresses at which the Prometheus server service is available
    ## Ref: https://kubernetes.io/docs/user-guide/services/#external-ips
    ##
    externalIPs: []

    loadBalancerIP: ""
    loadBalancerSourceRanges: []
    servicePort: 80
    type: ClusterIP

  ## Prometheus server pod termination grace period
  ##
  terminationGracePeriodSeconds: 300

  ## Prometheus data retention period (i.e 360h)
  ##
  retention: ""

pushgateway:
  ## If false, pushgateway will not be installed
  ##
  enabled: true

  ## pushgateway container name
  ##
  name: pushgateway

  ## pushgateway container image
  ##
  image:
    repository: prom/pushgateway
    tag: v0.4.0
    pullPolicy: IfNotPresent

  ## Additional pushgateway container arguments
  ##
  extraArgs: {}

  ingress:
    ## If true, pushgateway Ingress will be created
    ##
    enabled: false

    ## pushgateway Ingress annotations
    ##
    annotations:
    #   kubernetes.io/ingress.class: nginx
    #   kubernetes.io/tls-acme: 'true'

    ## pushgateway Ingress hostnames
    ## Must be provided if Ingress is enabled
    ##
    hosts: []
    #   - pushgateway.domain.com

    ## pushgateway Ingress TLS configuration
    ## Secrets must be manually created in the namespace
    ##
    tls: []
    #   - secretName: prometheus-alerts-tls
    #     hosts:
    #       - pushgateway.domain.com

  ## Node labels for pushgateway pod assignment
  ## Ref: https://kubernetes.io/docs/user-guide/node-selection/
  ##
  nodeSelector: {}

  ## Annotations to be added to pushgateway pods
  ##
  podAnnotations: {}

  replicaCount: 1

  ## pushgateway resource requests and limits
  ## Ref: http://kubernetes.io/docs/user-guide/compute-resources/
  ##
  resources: {}
    # limits:
    #   cpu: 10m
    #   memory: 32Mi
    # requests:
    #   cpu: 10m
    #   memory: 32Mi

  service:
    annotations:
      prometheus.io/probe: pushgateway
    labels: {}
    clusterIP: ""

    ## List of IP addresses at which the pushgateway service is available
    ## Ref: https://kubernetes.io/docs/user-guide/services/#external-ips
    ##
    externalIPs: []

    loadBalancerIP: ""
    loadBalancerSourceRanges: []
    servicePort: 9091
    type: ClusterIP

## alertmanager ConfigMap entries
##
alertmanagerFiles:
  alertmanager.yml: |-
    global:
      # slack_api_url: ''
    receivers:
      - name: default-receiver
        # slack_configs:
        #  - channel: '@you'
        #    send_resolved: true
    route:
      group_wait: 10s
      group_interval: 5m
      receiver: default-receiver
      repeat_interval: 3h
## Prometheus server ConfigMap entries
##
serverFiles:
  alerts: ""
  rules: ""

  prometheus.yml: |-
    rule_files:
      - /etc/config/rules
      - /etc/config/alerts
    scrape_configs:
      - job_name: 'demo-app'
        scrape_interval: 5s
        metrics_path: '/prometheus'
        static_configs:
          - targets:
            - github-analytics.sc-pipelines-prod.svc.cluster.local:8080
      - job_name: prometheus
        static_configs:
          - targets:
            - localhost:9090
      # A scrape configuration for running Prometheus on a Kubernetes cluster.
      # This uses separate scrape configs for cluster components (i.e. API server, node)
      # and services to allow each to use different authentication configs.
      #
      # Kubernetes labels will be added as Prometheus labels on metrics via the
      # `labelmap` relabeling action.
      # Scrape config for API servers.
      #
      # Kubernetes exposes API servers as endpoints to the default/kubernetes
      # service so this uses `endpoints` role and uses relabelling to only keep
      # the endpoints associated with the default/kubernetes service using the
      # default named port `https`. This works for single API server deployments as
      # well as HA API server deployments.
      - job_name: 'kubernetes-apiservers'
        kubernetes_sd_configs:
          - role: endpoints
        # Default to scraping over https. If required, just disable this or change to
        # `http`.
        scheme: https
        # This TLS & bearer token file config is used to connect to the actual scrape
        # endpoints for cluster components. This is separate to discovery auth
        # configuration because discovery & scraping are two separate concerns in
        # Prometheus. The discovery auth config is automatic if Prometheus runs inside
        # the cluster. Otherwise, more config options have to be provided within the
        # <kubernetes_sd_config>.
        tls_config:
          ca_file: /var/run/secrets/kubernetes.io/serviceaccount/ca.crt
          # If your node certificates are self-signed or use a different CA to the
          # master CA, then disable certificate verification below. Note that
          # certificate verification is an integral part of a secure infrastructure
          # so this should only be disabled in a controlled environment. You can
          # disable certificate verification by uncommenting the line below.
          #
          insecure_skip_verify: true
        bearer_token_file: /var/run/secrets/kubernetes.io/serviceaccount/token
        # Keep only the default/kubernetes service endpoints for the https port. This
        # will add targets for each API server which Kubernetes adds an endpoint to
        # the default/kubernetes service.
        relabel_configs:
          - source_labels: [__meta_kubernetes_namespace, __meta_kubernetes_service_name, __meta_kubernetes_endpoint_port_name]
            action: keep
            regex: default;kubernetes;https
      - job_name: 'kubernetes-nodes'
        # Default to scraping over https. If required, just disable this or change to
        # `http`.
        scheme: https
        # This TLS & bearer token file config is used to connect to the actual scrape
        # endpoints for cluster components. This is separate to discovery auth
        # configuration because discovery & scraping are two separate concerns in
        # Prometheus. The discovery auth config is automatic if Prometheus runs inside
        # the cluster. Otherwise, more config options have to be provided within the
        # <kubernetes_sd_config>.
        tls_config:
          ca_file: /var/run/secrets/kubernetes.io/serviceaccount/ca.crt
          # If your node certificates are self-signed or use a different CA to the
          # master CA, then disable certificate verification below. Note that
          # certificate verification is an integral part of a secure infrastructure
          # so this should only be disabled in a controlled environment. You can
          # disable certificate verification by uncommenting the line below.
          #
          insecure_skip_verify: true
        bearer_token_file: /var/run/secrets/kubernetes.io/serviceaccount/token
        kubernetes_sd_configs:
          - role: node
        relabel_configs:
          - action: labelmap
            regex: __meta_kubernetes_node_label_(.+)
          - target_label: __address__
            replacement: kubernetes.default.svc:443
          - source_labels: [__meta_kubernetes_node_name]
            regex: (.+)
            target_label: __metrics_path__
            replacement: /api/v1/nodes/${1}/proxy/metrics
      # Scrape config for service endpoints.
      #
      # The relabeling allows the actual service scrape endpoint to be configured
      # via the following annotations:
      #
      # * `prometheus.io/scrape`: Only scrape services that have a value of `true`
      # * `prometheus.io/scheme`: If the metrics endpoint is secured then you will need
      # to set this to `https` & most likely set the `tls_config` of the scrape config.
      # * `prometheus.io/path`: If the metrics path is not `/metrics` override this.
      # * `prometheus.io/port`: If the metrics are exposed on a different port to the
      # service then set this appropriately.
      - job_name: 'kubernetes-service-endpoints'
        kubernetes_sd_configs:
          - role: endpoints
        relabel_configs:
          - source_labels: [__meta_kubernetes_service_annotation_prometheus_io_scrape]
            action: keep
            regex: true
          - source_labels: [__meta_kubernetes_service_annotation_prometheus_io_scheme]
            action: replace
            target_label: __scheme__
            regex: (https?)
          - source_labels: [__meta_kubernetes_service_annotation_prometheus_io_path]
            action: replace
            target_label: __metrics_path__
            regex: (.+)
          - source_labels: [__address__, __meta_kubernetes_service_annotation_prometheus_io_port]
            action: replace
            target_label: __address__
            regex: (.+)(?::\d+);(\d+)
            replacement: $1:$2
          - action: labelmap
            regex: __meta_kubernetes_service_label_(.+)
          - source_labels: [__meta_kubernetes_namespace]
            action: replace
            target_label: kubernetes_namespace
          - source_labels: [__meta_kubernetes_service_name]
            action: replace
            target_label: kubernetes_name
      - job_name: 'prometheus-pushgateway'
        honor_labels: true
        kubernetes_sd_configs:
          - role: service
        relabel_configs:
          - source_labels: [__meta_kubernetes_service_annotation_prometheus_io_probe]
            action: keep
            regex: pushgateway
      # Example scrape config for probing services via the Blackbox Exporter.
      #
      # The relabeling allows the actual service scrape endpoint to be configured
      # via the following annotations:
      #
      # * `prometheus.io/probe`: Only probe services that have a value of `true`
      - job_name: 'kubernetes-services'
        metrics_path: /probe
        params:
          module: [http_2xx]
        kubernetes_sd_configs:
          - role: service
        relabel_configs:
          - source_labels: [__meta_kubernetes_service_annotation_prometheus_io_probe]
            action: keep
            regex: true
          - source_labels: [__address__]
            target_label: __param_target
          - target_label: __address__
            replacement: blackbox
          - source_labels: [__param_target]
            target_label: instance
          - action: labelmap
            regex: __meta_kubernetes_service_label_(.+)
          - source_labels: [__meta_kubernetes_namespace]
            target_label: kubernetes_namespace
          - source_labels: [__meta_kubernetes_service_name]
            target_label: kubernetes_name
      # Example scrape config for pods
      #
      # The relabeling allows the actual pod scrape endpoint to be configured via the
      # following annotations:
      #
      # * `prometheus.io/scrape`: Only scrape pods that have a value of `true`
      # * `prometheus.io/path`: If the metrics path is not `/metrics` override this.
      # * `prometheus.io/port`: Scrape the pod on the indicated port instead of the default of `9102`.
      - job_name: 'kubernetes-pods'
        kubernetes_sd_configs:
          - role: pod
        relabel_configs:
          - source_labels: [__meta_kubernetes_pod_annotation_prometheus_io_scrape]
            action: keep
            regex: true
          - source_labels: [__meta_kubernetes_pod_annotation_prometheus_io_path]
            action: replace
            target_label: __metrics_path__
            regex: (.+)
          - source_labels: [__address__, __meta_kubernetes_pod_annotation_prometheus_io_port]
            action: replace
            regex: (.+):(?:\d+);(\d+)
            replacement: ${1}:${2}
            target_label: __address__
          - action: labelmap
            regex: __meta_kubernetes_pod_label_(.+)
          - source_labels: [__meta_kubernetes_namespace]
            action: replace
            target_label: kubernetes_namespace
          - source_labels: [__meta_kubernetes_pod_name]
            action: replace
            target_label: kubernetes_pod_name
networkPolicy:
  ## Enable creation of NetworkPolicy resources.
  ##
  enabled: false
Next, let’s create the prometheus installation with the predefined values.
$ helm install --name sc-pipelines-prometheus stable/prometheus -f values.yaml
Then you should see the following output
NOTES:
The Prometheus server can be accessed via port 80 on the following DNS name from within your cluster:
sc-pipelines-prometheus-prometheus-server.default.svc.cluster.local


Get the Prometheus server URL by running these commands in the same shell:
  export POD_NAME=$(kubectl get pods --namespace default -l "app=prometheus,component=server" -o jsonpath="{.items[0].metadata.name}")
  kubectl --namespace default port-forward $POD_NAME 9090


The Prometheus alertmanager can be accessed via port 80 on the following DNS name from within your cluster:
sc-pipelines-prometheus-prometheus-alertmanager.default.svc.cluster.local


Get the Alertmanager URL by running these commands in the same shell:
  export POD_NAME=$(kubectl get pods --namespace default -l "app=prometheus,component=alertmanager" -o jsonpath="{.items[0].metadata.name}")
  kubectl --namespace default port-forward $POD_NAME 9093


The Prometheus PushGateway can be accessed via port 9091 on the following DNS name from within your cluster:
sc-pipelines-prometheus-prometheus-pushgateway.default.svc.cluster.local


Get the PushGateway URL by running these commands in the same shell:
  export POD_NAME=$(kubectl get pods --namespace default -l "app=prometheus,component=pushgateway" -o jsonpath="{.items[0].metadata.name}")
  kubectl --namespace default port-forward $POD_NAME 9093

For more information on running Prometheus, visit:
https://prometheus.io/
Use Helm to install Grafana
$ helm install --name sc-pipelines-grafana stable/grafana
NOTES:
1. Get your 'admin' user password by running:

   kubectl get secret --namespace default sc-pipelines-grafana-grafana -o jsonpath="{.data.grafana-admin-password}" | base64 --decode ; echo

2. The Grafana server can be accessed via port 80 on the following DNS name from within your cluster:

   sc-pipelines-grafana-grafana.default.svc.cluster.local

   Get the Grafana URL to visit by running these commands in the same shell:

     export POD_NAME=$(kubectl get pods --namespace default -l "app=sc-pipelines-grafana-grafana,component=grafana" -o jsonpath="{.items[0].metadata.name}")
     kubectl --namespace default port-forward $POD_NAME 3000

3. Login with the password from step 1 and the username: admin
Perform the aforementioned steps and add the Grafana’s datasource
as Prometheus with URL http://sc-pipelines-prometheus-prometheus-server.default.svc.cluster.local
You can pick the dashboard via the Grafana ID (2471). This is the default dashboard for the Spring Cloud Pipelines demo apps.
If you have both apps (github-webhook and github-analytics) running on production
we can now trigger the messages. Download the JSON with a sample request
from the github-webhook repository.
Next, pick one of the github-webhook pods and forward its port
locally to a port 9876 like this:
$ kubectl port-forward --namespace=sc-pipelines-prod $( kubectl get pods --namespace=sc-pipelines-prod | grep github-webhook | head -1 | awk '{print $1}' ) 9876:8080
next send a couple of requests (more than 4).
$ curl -X POST http://localhost:9876/ -d @path/to/issue-created.json \
--header "Content-Type: application/json"
Then if you check out Grafana you’ll see that you went above the threshold.
As prerequisites you need to have shellcheck,
bats, jq
and ruby installed. If you’re on a Linux
machine then bats and shellcheck will be installed for you.
To install the required software on Linux just type the following commands
$ sudo apt-get install -y ruby jq
If you’re on a Mac then just execute these commands to install the missing software
$ brew install jq
$ brew install ruby
$ brew install bats
$ brew install shellcheck
To make bats work properly we needed to attach Git submodules. To have them
initialized either clone with appropriate command
$ git clone --recursive https://github.com/spring-cloud/spring-cloud-pipelines.git
or if you have already cloned the project and are just pulling changes
$ git submodule init
$ git submodule update
If you forget about this step, then Gradle will execute these steps for you.
Once you have installed all the prerequisites you can execute
$ ./gradlew clean build
to build and test the project.
If you want to pick only pieces (e.g. you’re interested only in Cloud Foundry with
Concourse combination) it’s enough to execute this command:
$ ./gradlew customize
You’ll see a screen looking more or less like this:
:customize
  ___          _              ___ _             _   ___ _           _ _
 / __|_ __ _ _(_)_ _  __ _   / __| |___ _  _ __| | | _ (_)_ __  ___| (_)_ _  ___ ___
 \__ \ '_ \ '_| | ' \/ _` | | (__| / _ \ || / _` | |  _/ | '_ \/ -_) | | ' \/ -_|_-<
 |___/ .__/_| |_|_||_\__, |  \___|_\___/\_,_\__,_| |_| |_| .__/\___|_|_|_||_\___/__/
     |_|             |___/                               |_|


Follow the instructions presented in the console or terminate the process to quit (ctrl + c)


=== PAAS TYPE ===
Which PAAS type do you want to use? Options: [CF, K8S, BOTH]
<-------------> 0% EXECUTING
> :customize
Now you need to answer a couple of questions. That way whole files and its pieces
will get removed / updated accordingly. If you provide CF and Concourse options
thn Kubernetes and Jenkins configuration / folders / pieces of code in
the project will get removed.
When doing a release you also need to push a Docker image to Dockerhub.
From the project root, run the following commands replacing <version> with the
version of the release.
docker login
docker build -t springcloud/spring-cloud-pipeline-jenkins:<version> ./jenkins
docker push springcloud/spring-cloud-pipeline-jenkins:<version>