The demo uses 2 applications. Github Webhook and Github analytics code. Below you can see an image of how these application communicate with each other.
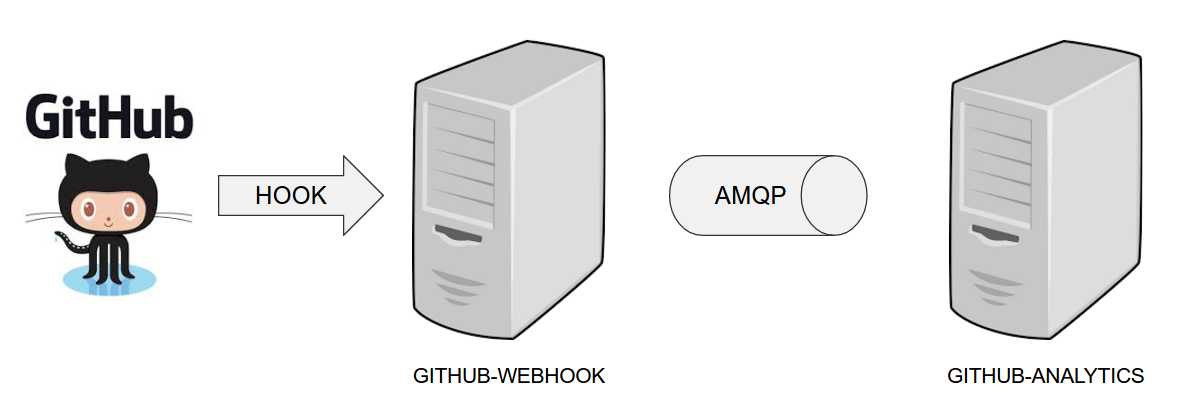
For the demo scenario we have two applications. Github Analytics and Github Webhook.
Let’s imagine a case where Github is emitting events via HTTP. Github Webhook has
an API that could register to such hooks and receive those messages. Once this happens
Github Webhook sends a message by RabbitMQ to a channel. Github Analytics is
listening to those messages and stores them in a MySQL database.
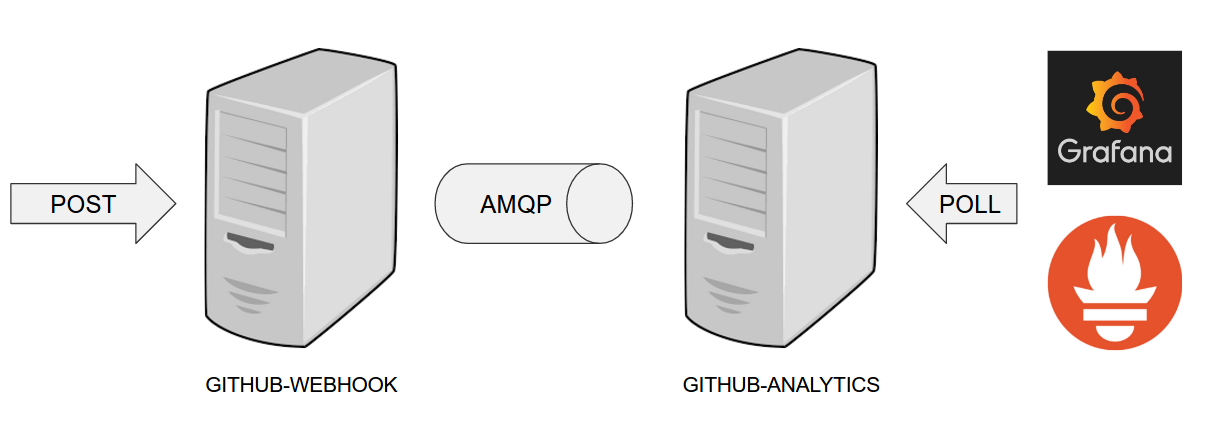
Github Analytics has its KPIs (Key Performance Indicators) monitored. In the case
of that application the KPI is number of issues.
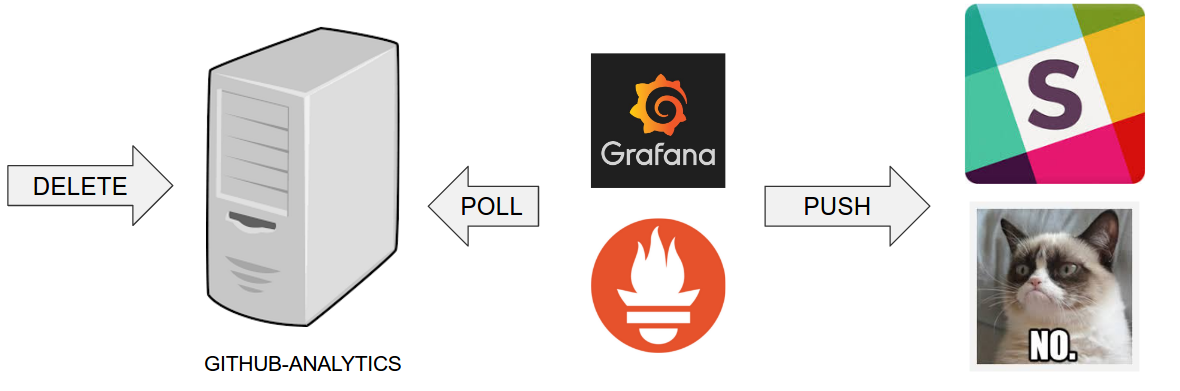
Let’s assume that if we go below the threshold of X issues then an alert should be sent to Slack.
In the real world scenario we wouldn’t want to automatically provision services like
RabbitMQ, MySQL or Eureka each time we deploy a new application to production. Typically
production is provisioned manually (using automated solutions). In our case, before
you deploy to production you can provision the pcfdev-prod space using the
cf-helper.sh. Just call
$ ./cf-helper.sh setup-prod-infra
What will happen is that the CF CLI will login to PCF Dev, target pcfdev-prod space,
setup RabbitMQ (under rabbitmq-github name), MySQL (under mysql-github-analytics name)
and Eureka (under github-eureka name).
You can check out Toshiaki Maki’s code on how to automate Prometheus installation on CF.
Go to https://prometheus.io/download/ and download linux binary. Then call:
cf push sc-pipelines-prometheus -b binary_buildpack -c './prometheus -web.listen-address=:8080' -m 64m
Also localhost:9090 in prometheus.yml should be localhost:8080.
The file should look like this to work with the demo setup (change github-analytics-sc-pipelines.cfapps.io
to your github-analytics installation).
# my global config
global:
  scrape_interval:     15s # Set the scrape interval to every 15 seconds. Default is every 1 minute.
  evaluation_interval: 15s # Evaluate rules every 15 seconds. The default is every 1 minute.
  # scrape_timeout is set to the global default (10s).

  # Attach these labels to any time series or alerts when communicating with
  # external systems (federation, remote storage, Alertmanager).
  external_labels:
      monitor: 'codelab-monitor'

# Load rules once and periodically evaluate them according to the global 'evaluation_interval'.
rule_files:
  # - "first.rules"
  # - "second.rules"

# A scrape configuration containing exactly one endpoint to scrape:
# Here it's Prometheus itself.
scrape_configs:
  # The job name is added as a label `job=<job_name>` to any timeseries scraped from this config.
  - job_name: 'prometheus'

    # metrics_path defaults to '/metrics'
    # scheme defaults to 'http'.

    static_configs:
      - targets: ['localhost:8080']

  - job_name: 'demo-app'

    # Override the global default and scrape targets from this job every 5 seconds.
    scrape_interval: 5s

    metrics_path: '/prometheus'
    # scheme defaults to 'http'.

    static_configs:
      - targets: ['github-analytics-sc-pipelines.cfapps.io']
A deployed version for the Spring Cloud Pipelines demo is available here
You can check out Toshiaki Maki’s code on how to automate Prometheus installation on CF.
Download tarball from https://grafana.com/grafana/download?platform=linux
Next set http_port = 8080 in conf/default.ini. Then call
cf push sc-pipelines-grafana -b binary_buildpack -c './bin/grafana-server web' -m 64m
The demo is using Grafana Dashboard with ID 2471.
A deployed version for the Spring Cloud Pipelines demo is available here