The demo uses 2 applications. Github Webhook and Github analytics code. Below you can see an image of how these application communicate with each other.
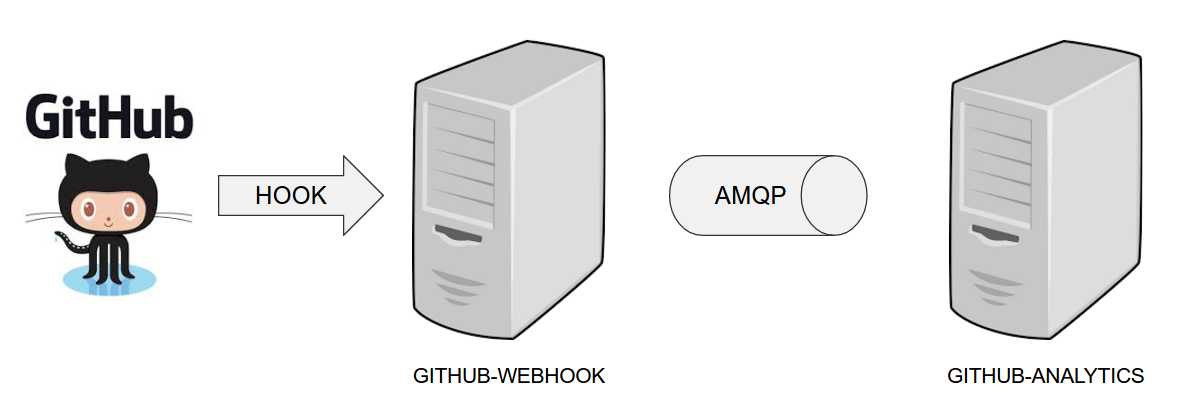
For the demo scenario we have two applications. Github Analytics and Github Webhook.
Let’s imagine a case where Github is emitting events via HTTP. Github Webhook has
an API that could register to such hooks and receive those messages. Once this happens
Github Webhook sends a message by RabbitMQ to a channel. Github Analytics is
listening to those messages and stores them in a MySQL database.
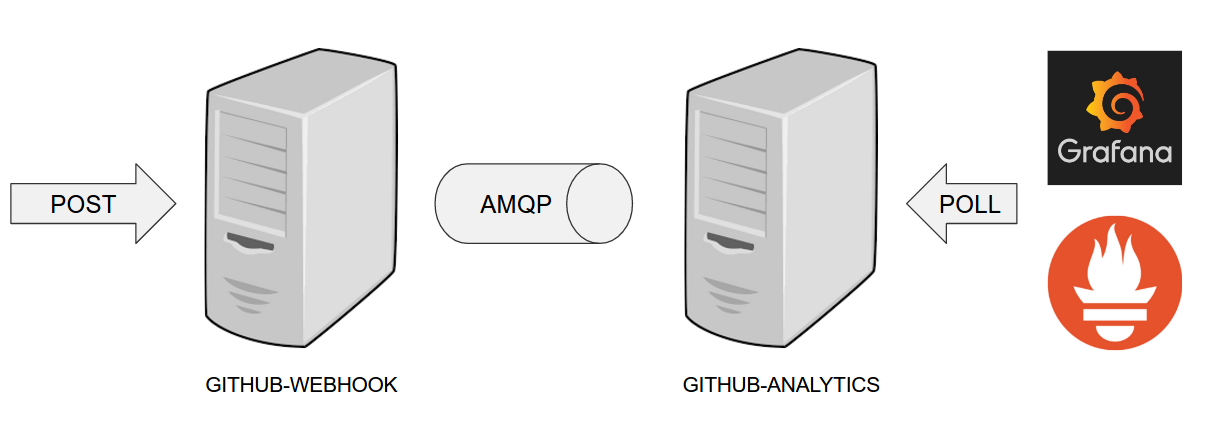
Github Analytics has its KPIs (Key Performance Indicators) monitored. In the case
of that application the KPI is number of issues.
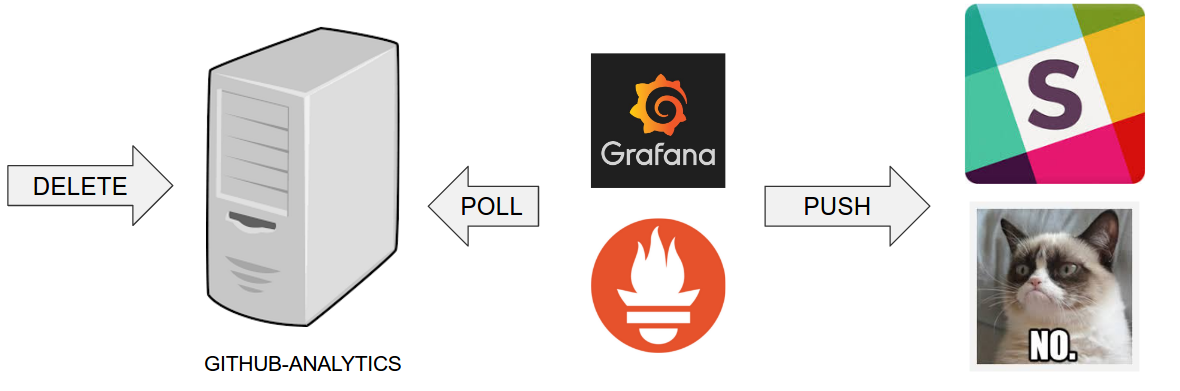
Let’s assume that if we go below the threshold of X issues then an alert should be sent to Slack.
In the real world scenario we wouldn’t want to automatically provision services like
RabbitMQ, MySQL or Eureka each time we deploy a new application to production. Typically
production is provisioned manually (using automated solutions). In our case, before
you deploy to production you can provision the sc-pipelines-prod namespace using the
k8s-helper.sh. Just call
$ ./k8s-helper.sh setup-prod-infra
Use Helm to install Prometheus. We will point it to the services deployed to our cluster.
Create a file called values.yaml.
values.yaml.
rbac:
  create: false

alertmanager:
  ## If false, alertmanager will not be installed
  ##
  enabled: true

  # Defines the serviceAccountName to use when `rbac.create=false`
  serviceAccountName: default

  ## alertmanager container name
  ##
  name: alertmanager

  ## alertmanager container image
  ##
  image:
    repository: prom/alertmanager
    tag: v0.9.1
    pullPolicy: IfNotPresent

  ## Additional alertmanager container arguments
  ##
  extraArgs: {}

  ## The URL prefix at which the container can be accessed. Useful in the case the '-web.external-url' includes a slug
  ## so that the various internal URLs are still able to access as they are in the default case.
  ## (Optional)
  baseURL: ""

  ## Additional alertmanager container environment variable
  ## For instance to add a http_proxy
  ##
  extraEnv: {}

  ## ConfigMap override where fullname is {{.Release.Name}}-{{.Values.alertmanager.configMapOverrideName}}
  ## Defining configMapOverrideName will cause templates/alertmanager-configmap.yaml
  ## to NOT generate a ConfigMap resource
  ##
  configMapOverrideName: ""

  ingress:
    ## If true, alertmanager Ingress will be created
    ##
    enabled: false

    ## alertmanager Ingress annotations
    ##
    annotations: {}
    #   kubernetes.io/ingress.class: nginx
    #   kubernetes.io/tls-acme: 'true'

    ## alertmanager Ingress hostnames
    ## Must be provided if Ingress is enabled
    ##
    hosts: []
    #   - alertmanager.domain.com

    ## alertmanager Ingress TLS configuration
    ## Secrets must be manually created in the namespace
    ##
    tls: []
    #   - secretName: prometheus-alerts-tls
    #     hosts:
    #       - alertmanager.domain.com

  ## Alertmanager Deployment Strategy type
  # strategy:
  #   type: Recreate

  ## Node labels for alertmanager pod assignment
  ## Ref: https://kubernetes.io/docs/user-guide/node-selection/
  ##
  nodeSelector: {}

  persistentVolume:
    ## If true, alertmanager will create/use a Persistent Volume Claim
    ## If false, use emptyDir
    ##
    enabled: true

    ## alertmanager data Persistent Volume access modes
    ## Must match those of existing PV or dynamic provisioner
    ## Ref: http://kubernetes.io/docs/user-guide/persistent-volumes/
    ##
    accessModes:
      - ReadWriteOnce

    ## alertmanager data Persistent Volume Claim annotations
    ##
    annotations: {}

    ## alertmanager data Persistent Volume existing claim name
    ## Requires alertmanager.persistentVolume.enabled: true
    ## If defined, PVC must be created manually before volume will be bound
    existingClaim: ""

    ## alertmanager data Persistent Volume mount root path
    ##
    mountPath: /data

    ## alertmanager data Persistent Volume size
    ##
    size: 2Gi

    ## alertmanager data Persistent Volume Storage Class
    ## If defined, storageClassName: <storageClass>
    ## If set to "-", storageClassName: "", which disables dynamic provisioning
    ## If undefined (the default) or set to null, no storageClassName spec is
    ##   set, choosing the default provisioner.  (gp2 on AWS, standard on
    ##   GKE, AWS & OpenStack)
    ##
    # storageClass: "-"

    ## Subdirectory of alertmanager data Persistent Volume to mount
    ## Useful if the volume's root directory is not empty
    ##
    subPath: ""

  ## Annotations to be added to alertmanager pods
  ##
  podAnnotations: {}

  replicaCount: 1

  ## alertmanager resource requests and limits
  ## Ref: http://kubernetes.io/docs/user-guide/compute-resources/
  ##
  resources: {}
    # limits:
    #   cpu: 10m
    #   memory: 32Mi
    # requests:
    #   cpu: 10m
    #   memory: 32Mi

  service:
    annotations: {}
    labels: {}
    clusterIP: ""

    ## List of IP addresses at which the alertmanager service is available
    ## Ref: https://kubernetes.io/docs/user-guide/services/#external-ips
    ##
    externalIPs: []

    loadBalancerIP: ""
    loadBalancerSourceRanges: []
    servicePort: 80
    # nodePort: 30000
    type: ClusterIP

## Monitors ConfigMap changes and POSTs to a URL
## Ref: https://github.com/jimmidyson/configmap-reload
##
configmapReload:
  ## configmap-reload container name
  ##
  name: configmap-reload

  ## configmap-reload container image
  ##
  image:
    repository: jimmidyson/configmap-reload
    tag: v0.1
    pullPolicy: IfNotPresent

  ## configmap-reload resource requests and limits
  ## Ref: http://kubernetes.io/docs/user-guide/compute-resources/
  ##
  resources: {}

kubeStateMetrics:
  ## If false, kube-state-metrics will not be installed
  ##
  enabled: true

  # Defines the serviceAccountName to use when `rbac.create=false`
  serviceAccountName: default

  ## kube-state-metrics container name
  ##
  name: kube-state-metrics

  ## kube-state-metrics container image
  ##
  image:
    repository: gcr.io/google_containers/kube-state-metrics
    tag: v1.1.0-rc.0
    pullPolicy: IfNotPresent

  ## Node labels for kube-state-metrics pod assignment
  ## Ref: https://kubernetes.io/docs/user-guide/node-selection/
  ##
  nodeSelector: {}

  ## Annotations to be added to kube-state-metrics pods
  ##
  podAnnotations: {}

  replicaCount: 1

  ## kube-state-metrics resource requests and limits
  ## Ref: http://kubernetes.io/docs/user-guide/compute-resources/
  ##
  resources: {}
    # limits:
    #   cpu: 10m
    #   memory: 16Mi
    # requests:
    #   cpu: 10m
    #   memory: 16Mi

  service:
    annotations:
      prometheus.io/scrape: "true"
    labels: {}

    clusterIP: None

    ## List of IP addresses at which the kube-state-metrics service is available
    ## Ref: https://kubernetes.io/docs/user-guide/services/#external-ips
    ##
    externalIPs: []

    loadBalancerIP: ""
    loadBalancerSourceRanges: []
    servicePort: 80
    type: ClusterIP

nodeExporter:
  ## If false, node-exporter will not be installed
  ##
  enabled: true

  # Defines the serviceAccountName to use when `rbac.create=false`
  serviceAccountName: default

  ## node-exporter container name
  ##
  name: node-exporter

  ## node-exporter container image
  ##
  image:
    repository: prom/node-exporter
    tag: v0.15.0
    pullPolicy: IfNotPresent

  ## Additional node-exporter container arguments
  ##
  extraArgs: {}

  ## Additional node-exporter hostPath mounts
  ##
  extraHostPathMounts: []
    # - name: textfile-dir
    #   mountPath: /srv/txt_collector
    #   hostPath: /var/lib/node-exporter
    #   readOnly: true

  ## Node tolerations for node-exporter scheduling to nodes with taints
  ## Ref: https://kubernetes.io/docs/concepts/configuration/assign-pod-node/
  ##
  tolerations: []
    # - key: "key"
    #   operator: "Equal|Exists"
    #   value: "value"
    #   effect: "NoSchedule|PreferNoSchedule|NoExecute(1.6 only)"

  ## Node labels for node-exporter pod assignment
  ## Ref: https://kubernetes.io/docs/user-guide/node-selection/
  ##
  nodeSelector: {}

  ## Annotations to be added to node-exporter pods
  ##
  podAnnotations: {}

  ## node-exporter resource limits & requests
  ## Ref: https://kubernetes.io/docs/user-guide/compute-resources/
  ##
  resources: {}
    # limits:
    #   cpu: 200m
    #   memory: 50Mi
    # requests:
    #   cpu: 100m
    #   memory: 30Mi

  service:
    annotations:
      prometheus.io/scrape: "true"
    labels: {}

    clusterIP: None

    ## List of IP addresses at which the node-exporter service is available
    ## Ref: https://kubernetes.io/docs/user-guide/services/#external-ips
    ##
    externalIPs: []

    hostPort: 9100
    loadBalancerIP: ""
    loadBalancerSourceRanges: []
    servicePort: 9100
    type: ClusterIP

server:
  ## Prometheus server container name
  ##
  name: server

  # Defines the serviceAccountName to use when `rbac.create=false`
  serviceAccountName: default

  ## Prometheus server container image
  ##
  image:
    repository: prom/prometheus
    tag: v1.8.0
    pullPolicy: IfNotPresent

  ## (optional) alertmanager URL
  ## only used if alertmanager.enabled = false
  alertmanagerURL: ""

  ## The URL prefix at which the container can be accessed. Useful in the case the '-web.external-url' includes a slug
  ## so that the various internal URLs are still able to access as they are in the default case.
  ## (Optional)
  baseURL: ""

  ## Additional Prometheus server container arguments
  ##
  extraArgs: {}

  ## Additional Prometheus server hostPath mounts
  ##
  extraHostPathMounts: []
    # - name: certs-dir
    #   mountPath: /etc/kubernetes/certs
    #   hostPath: /etc/kubernetes/certs
    #   readOnly: true

  ## ConfigMap override where fullname is {{.Release.Name}}-{{.Values.server.configMapOverrideName}}
  ## Defining configMapOverrideName will cause templates/server-configmap.yaml
  ## to NOT generate a ConfigMap resource
  ##
  configMapOverrideName: ""

  ingress:
    ## If true, Prometheus server Ingress will be created
    ##
    enabled: false

    ## Prometheus server Ingress annotations
    ##
    annotations: {}
    #   kubernetes.io/ingress.class: nginx
    #   kubernetes.io/tls-acme: 'true'

    ## Prometheus server Ingress hostnames
    ## Must be provided if Ingress is enabled
    ##
    hosts: []
    #   - prometheus.domain.com

    ## Prometheus server Ingress TLS configuration
    ## Secrets must be manually created in the namespace
    ##
    tls: []
    #   - secretName: prometheus-server-tls
    #     hosts:
    #       - prometheus.domain.com

  ## Server Deployment Strategy type
  # strategy:
  #   type: Recreate

  ## Node tolerations for server scheduling to nodes with taints
  ## Ref: https://kubernetes.io/docs/concepts/configuration/assign-pod-node/
  ##
  tolerations: []
    # - key: "key"
    #   operator: "Equal|Exists"
    #   value: "value"
    #   effect: "NoSchedule|PreferNoSchedule|NoExecute(1.6 only)"

  ## Node labels for Prometheus server pod assignment
  ## Ref: https://kubernetes.io/docs/user-guide/node-selection/
  nodeSelector: {}

  persistentVolume:
    ## If true, Prometheus server will create/use a Persistent Volume Claim
    ## If false, use emptyDir
    ##
    enabled: true

    ## Prometheus server data Persistent Volume access modes
    ## Must match those of existing PV or dynamic provisioner
    ## Ref: http://kubernetes.io/docs/user-guide/persistent-volumes/
    ##
    accessModes:
      - ReadWriteOnce

    ## Prometheus server data Persistent Volume annotations
    ##
    annotations: {}

    ## Prometheus server data Persistent Volume existing claim name
    ## Requires server.persistentVolume.enabled: true
    ## If defined, PVC must be created manually before volume will be bound
    existingClaim: ""

    ## Prometheus server data Persistent Volume mount root path
    ##
    mountPath: /data

    ## Prometheus server data Persistent Volume size
    ##
    size: 8Gi

    ## Prometheus server data Persistent Volume Storage Class
    ## If defined, storageClassName: <storageClass>
    ## If set to "-", storageClassName: "", which disables dynamic provisioning
    ## If undefined (the default) or set to null, no storageClassName spec is
    ##   set, choosing the default provisioner.  (gp2 on AWS, standard on
    ##   GKE, AWS & OpenStack)
    ##
    # storageClass: "-"

    ## Subdirectory of Prometheus server data Persistent Volume to mount
    ## Useful if the volume's root directory is not empty
    ##
    subPath: ""

  ## Annotations to be added to Prometheus server pods
  ##
  podAnnotations: {}
    # iam.amazonaws.com/role: prometheus

  replicaCount: 1

  ## Prometheus server resource requests and limits
  ## Ref: http://kubernetes.io/docs/user-guide/compute-resources/
  ##
  resources: {}
    # limits:
    #   cpu: 500m
    #   memory: 512Mi
    # requests:
    #   cpu: 500m
    #   memory: 512Mi

  service:
    annotations: {}
    labels: {}
    clusterIP: ""

    ## List of IP addresses at which the Prometheus server service is available
    ## Ref: https://kubernetes.io/docs/user-guide/services/#external-ips
    ##
    externalIPs: []

    loadBalancerIP: ""
    loadBalancerSourceRanges: []
    servicePort: 80
    type: ClusterIP

  ## Prometheus server pod termination grace period
  ##
  terminationGracePeriodSeconds: 300

  ## Prometheus data retention period (i.e 360h)
  ##
  retention: ""

pushgateway:
  ## If false, pushgateway will not be installed
  ##
  enabled: true

  ## pushgateway container name
  ##
  name: pushgateway

  ## pushgateway container image
  ##
  image:
    repository: prom/pushgateway
    tag: v0.4.0
    pullPolicy: IfNotPresent

  ## Additional pushgateway container arguments
  ##
  extraArgs: {}

  ingress:
    ## If true, pushgateway Ingress will be created
    ##
    enabled: false

    ## pushgateway Ingress annotations
    ##
    annotations:
    #   kubernetes.io/ingress.class: nginx
    #   kubernetes.io/tls-acme: 'true'

    ## pushgateway Ingress hostnames
    ## Must be provided if Ingress is enabled
    ##
    hosts: []
    #   - pushgateway.domain.com

    ## pushgateway Ingress TLS configuration
    ## Secrets must be manually created in the namespace
    ##
    tls: []
    #   - secretName: prometheus-alerts-tls
    #     hosts:
    #       - pushgateway.domain.com

  ## Node labels for pushgateway pod assignment
  ## Ref: https://kubernetes.io/docs/user-guide/node-selection/
  ##
  nodeSelector: {}

  ## Annotations to be added to pushgateway pods
  ##
  podAnnotations: {}

  replicaCount: 1

  ## pushgateway resource requests and limits
  ## Ref: http://kubernetes.io/docs/user-guide/compute-resources/
  ##
  resources: {}
    # limits:
    #   cpu: 10m
    #   memory: 32Mi
    # requests:
    #   cpu: 10m
    #   memory: 32Mi

  service:
    annotations:
      prometheus.io/probe: pushgateway
    labels: {}
    clusterIP: ""

    ## List of IP addresses at which the pushgateway service is available
    ## Ref: https://kubernetes.io/docs/user-guide/services/#external-ips
    ##
    externalIPs: []

    loadBalancerIP: ""
    loadBalancerSourceRanges: []
    servicePort: 9091
    type: ClusterIP

## alertmanager ConfigMap entries
##
alertmanagerFiles:
  alertmanager.yml: |-
    global:
      # slack_api_url: ''
    receivers:
      - name: default-receiver
        # slack_configs:
        #  - channel: '@you'
        #    send_resolved: true
    route:
      group_wait: 10s
      group_interval: 5m
      receiver: default-receiver
      repeat_interval: 3h
## Prometheus server ConfigMap entries
##
serverFiles:
  alerts: ""
  rules: ""

  prometheus.yml: |-
    rule_files:
      - /etc/config/rules
      - /etc/config/alerts
    scrape_configs:
      - job_name: 'demo-app'
        scrape_interval: 5s
        metrics_path: '/prometheus'
        static_configs:
          - targets:
            - github-analytics.sc-pipelines-prod.svc.cluster.local:8080
      - job_name: prometheus
        static_configs:
          - targets:
            - localhost:9090
      # A scrape configuration for running Prometheus on a Kubernetes cluster.
      # This uses separate scrape configs for cluster components (i.e. API server, node)
      # and services to allow each to use different authentication configs.
      #
      # Kubernetes labels will be added as Prometheus labels on metrics via the
      # `labelmap` relabeling action.
      # Scrape config for API servers.
      #
      # Kubernetes exposes API servers as endpoints to the default/kubernetes
      # service so this uses `endpoints` role and uses relabelling to only keep
      # the endpoints associated with the default/kubernetes service using the
      # default named port `https`. This works for single API server deployments as
      # well as HA API server deployments.
      - job_name: 'kubernetes-apiservers'
        kubernetes_sd_configs:
          - role: endpoints
        # Default to scraping over https. If required, just disable this or change to
        # `http`.
        scheme: https
        # This TLS & bearer token file config is used to connect to the actual scrape
        # endpoints for cluster components. This is separate to discovery auth
        # configuration because discovery & scraping are two separate concerns in
        # Prometheus. The discovery auth config is automatic if Prometheus runs inside
        # the cluster. Otherwise, more config options have to be provided within the
        # <kubernetes_sd_config>.
        tls_config:
          ca_file: /var/run/secrets/kubernetes.io/serviceaccount/ca.crt
          # If your node certificates are self-signed or use a different CA to the
          # master CA, then disable certificate verification below. Note that
          # certificate verification is an integral part of a secure infrastructure
          # so this should only be disabled in a controlled environment. You can
          # disable certificate verification by uncommenting the line below.
          #
          insecure_skip_verify: true
        bearer_token_file: /var/run/secrets/kubernetes.io/serviceaccount/token
        # Keep only the default/kubernetes service endpoints for the https port. This
        # will add targets for each API server which Kubernetes adds an endpoint to
        # the default/kubernetes service.
        relabel_configs:
          - source_labels: [__meta_kubernetes_namespace, __meta_kubernetes_service_name, __meta_kubernetes_endpoint_port_name]
            action: keep
            regex: default;kubernetes;https
      - job_name: 'kubernetes-nodes'
        # Default to scraping over https. If required, just disable this or change to
        # `http`.
        scheme: https
        # This TLS & bearer token file config is used to connect to the actual scrape
        # endpoints for cluster components. This is separate to discovery auth
        # configuration because discovery & scraping are two separate concerns in
        # Prometheus. The discovery auth config is automatic if Prometheus runs inside
        # the cluster. Otherwise, more config options have to be provided within the
        # <kubernetes_sd_config>.
        tls_config:
          ca_file: /var/run/secrets/kubernetes.io/serviceaccount/ca.crt
          # If your node certificates are self-signed or use a different CA to the
          # master CA, then disable certificate verification below. Note that
          # certificate verification is an integral part of a secure infrastructure
          # so this should only be disabled in a controlled environment. You can
          # disable certificate verification by uncommenting the line below.
          #
          insecure_skip_verify: true
        bearer_token_file: /var/run/secrets/kubernetes.io/serviceaccount/token
        kubernetes_sd_configs:
          - role: node
        relabel_configs:
          - action: labelmap
            regex: __meta_kubernetes_node_label_(.+)
          - target_label: __address__
            replacement: kubernetes.default.svc:443
          - source_labels: [__meta_kubernetes_node_name]
            regex: (.+)
            target_label: __metrics_path__
            replacement: /api/v1/nodes/${1}/proxy/metrics
      # Scrape config for service endpoints.
      #
      # The relabeling allows the actual service scrape endpoint to be configured
      # via the following annotations:
      #
      # * `prometheus.io/scrape`: Only scrape services that have a value of `true`
      # * `prometheus.io/scheme`: If the metrics endpoint is secured then you will need
      # to set this to `https` & most likely set the `tls_config` of the scrape config.
      # * `prometheus.io/path`: If the metrics path is not `/metrics` override this.
      # * `prometheus.io/port`: If the metrics are exposed on a different port to the
      # service then set this appropriately.
      - job_name: 'kubernetes-service-endpoints'
        kubernetes_sd_configs:
          - role: endpoints
        relabel_configs:
          - source_labels: [__meta_kubernetes_service_annotation_prometheus_io_scrape]
            action: keep
            regex: true
          - source_labels: [__meta_kubernetes_service_annotation_prometheus_io_scheme]
            action: replace
            target_label: __scheme__
            regex: (https?)
          - source_labels: [__meta_kubernetes_service_annotation_prometheus_io_path]
            action: replace
            target_label: __metrics_path__
            regex: (.+)
          - source_labels: [__address__, __meta_kubernetes_service_annotation_prometheus_io_port]
            action: replace
            target_label: __address__
            regex: (.+)(?::\d+);(\d+)
            replacement: $1:$2
          - action: labelmap
            regex: __meta_kubernetes_service_label_(.+)
          - source_labels: [__meta_kubernetes_namespace]
            action: replace
            target_label: kubernetes_namespace
          - source_labels: [__meta_kubernetes_service_name]
            action: replace
            target_label: kubernetes_name
      - job_name: 'prometheus-pushgateway'
        honor_labels: true
        kubernetes_sd_configs:
          - role: service
        relabel_configs:
          - source_labels: [__meta_kubernetes_service_annotation_prometheus_io_probe]
            action: keep
            regex: pushgateway
      # Example scrape config for probing services via the Blackbox Exporter.
      #
      # The relabeling allows the actual service scrape endpoint to be configured
      # via the following annotations:
      #
      # * `prometheus.io/probe`: Only probe services that have a value of `true`
      - job_name: 'kubernetes-services'
        metrics_path: /probe
        params:
          module: [http_2xx]
        kubernetes_sd_configs:
          - role: service
        relabel_configs:
          - source_labels: [__meta_kubernetes_service_annotation_prometheus_io_probe]
            action: keep
            regex: true
          - source_labels: [__address__]
            target_label: __param_target
          - target_label: __address__
            replacement: blackbox
          - source_labels: [__param_target]
            target_label: instance
          - action: labelmap
            regex: __meta_kubernetes_service_label_(.+)
          - source_labels: [__meta_kubernetes_namespace]
            target_label: kubernetes_namespace
          - source_labels: [__meta_kubernetes_service_name]
            target_label: kubernetes_name
      # Example scrape config for pods
      #
      # The relabeling allows the actual pod scrape endpoint to be configured via the
      # following annotations:
      #
      # * `prometheus.io/scrape`: Only scrape pods that have a value of `true`
      # * `prometheus.io/path`: If the metrics path is not `/metrics` override this.
      # * `prometheus.io/port`: Scrape the pod on the indicated port instead of the default of `9102`.
      - job_name: 'kubernetes-pods'
        kubernetes_sd_configs:
          - role: pod
        relabel_configs:
          - source_labels: [__meta_kubernetes_pod_annotation_prometheus_io_scrape]
            action: keep
            regex: true
          - source_labels: [__meta_kubernetes_pod_annotation_prometheus_io_path]
            action: replace
            target_label: __metrics_path__
            regex: (.+)
          - source_labels: [__address__, __meta_kubernetes_pod_annotation_prometheus_io_port]
            action: replace
            regex: (.+):(?:\d+);(\d+)
            replacement: ${1}:${2}
            target_label: __address__
          - action: labelmap
            regex: __meta_kubernetes_pod_label_(.+)
          - source_labels: [__meta_kubernetes_namespace]
            action: replace
            target_label: kubernetes_namespace
          - source_labels: [__meta_kubernetes_pod_name]
            action: replace
            target_label: kubernetes_pod_name
networkPolicy:
  ## Enable creation of NetworkPolicy resources.
  ##
  enabled: false
Next, let’s create the prometheus installation with the predefined values.
$ helm install --name sc-pipelines-prometheus stable/prometheus -f values.yaml
Then you should see the following output
NOTES:
The Prometheus server can be accessed via port 80 on the following DNS name from within your cluster:
sc-pipelines-prometheus-prometheus-server.default.svc.cluster.local


Get the Prometheus server URL by running these commands in the same shell:
  export POD_NAME=$(kubectl get pods --namespace default -l "app=prometheus,component=server" -o jsonpath="{.items[0].metadata.name}")
  kubectl --namespace default port-forward $POD_NAME 9090


The Prometheus alertmanager can be accessed via port 80 on the following DNS name from within your cluster:
sc-pipelines-prometheus-prometheus-alertmanager.default.svc.cluster.local


Get the Alertmanager URL by running these commands in the same shell:
  export POD_NAME=$(kubectl get pods --namespace default -l "app=prometheus,component=alertmanager" -o jsonpath="{.items[0].metadata.name}")
  kubectl --namespace default port-forward $POD_NAME 9093


The Prometheus PushGateway can be accessed via port 9091 on the following DNS name from within your cluster:
sc-pipelines-prometheus-prometheus-pushgateway.default.svc.cluster.local


Get the PushGateway URL by running these commands in the same shell:
  export POD_NAME=$(kubectl get pods --namespace default -l "app=prometheus,component=pushgateway" -o jsonpath="{.items[0].metadata.name}")
  kubectl --namespace default port-forward $POD_NAME 9093

For more information on running Prometheus, visit:
https://prometheus.io/
Use Helm to install Grafana
$ helm install --name sc-pipelines-grafana stable/grafana
NOTES:
1. Get your 'admin' user password by running:

   kubectl get secret --namespace default sc-pipelines-grafana-grafana -o jsonpath="{.data.grafana-admin-password}" | base64 --decode ; echo

2. The Grafana server can be accessed via port 80 on the following DNS name from within your cluster:

   sc-pipelines-grafana-grafana.default.svc.cluster.local

   Get the Grafana URL to visit by running these commands in the same shell:

     export POD_NAME=$(kubectl get pods --namespace default -l "app=sc-pipelines-grafana-grafana,component=grafana" -o jsonpath="{.items[0].metadata.name}")
     kubectl --namespace default port-forward $POD_NAME 3000

3. Login with the password from step 1 and the username: admin
Perform the aforementioned steps and add the Grafana’s datasource
as Prometheus with URL http://sc-pipelines-prometheus-prometheus-server.default.svc.cluster.local
You can pick the dashboard via the Grafana ID (2471). This is the default dashboard for the Spring Cloud Pipelines demo apps.
If you have both apps (github-webhook and github-analytics) running on production
we can now trigger the messages. Download the JSON with a sample request
from the github-webhook repository.
Next, pick one of the github-webhook pods and forward its port
locally to a port 9876 like this:
$ kubectl port-forward --namespace=sc-pipelines-prod $( kubectl get pods --namespace=sc-pipelines-prod | grep github-webhook | head -1 | awk '{print $1}' ) 9876:8080
next send a couple of requests (more than 4).
$ curl -X POST http://localhost:9876/ -d @path/to/issue-created.json \
--header "Content-Type: application/json"
Then if you check out Grafana you’ll see that you went above the threshold.